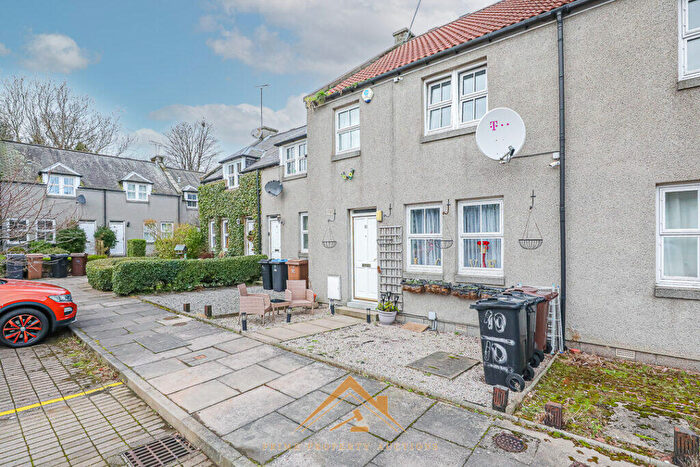
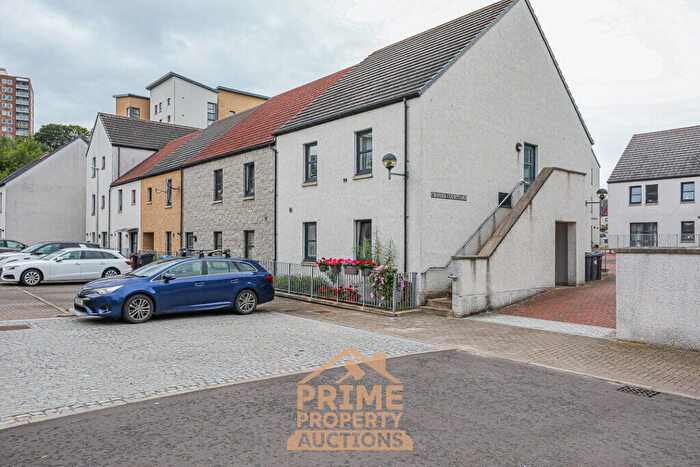
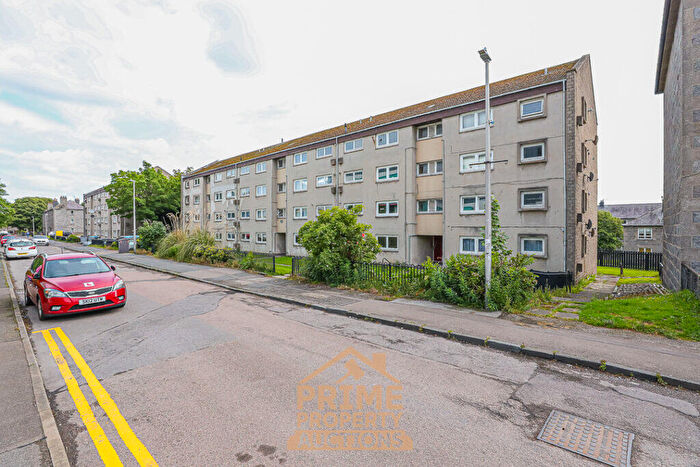
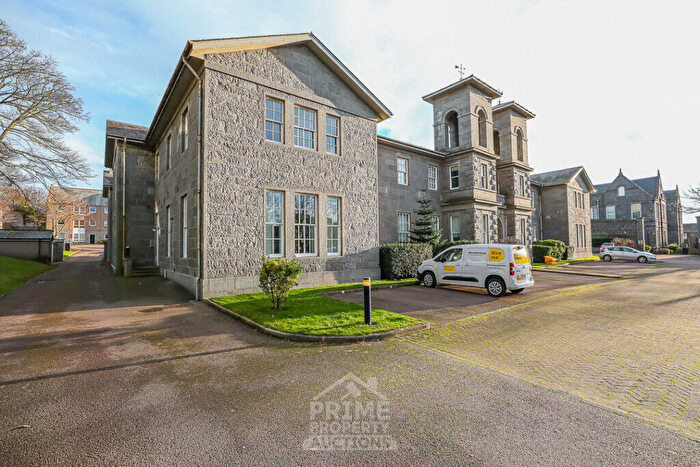
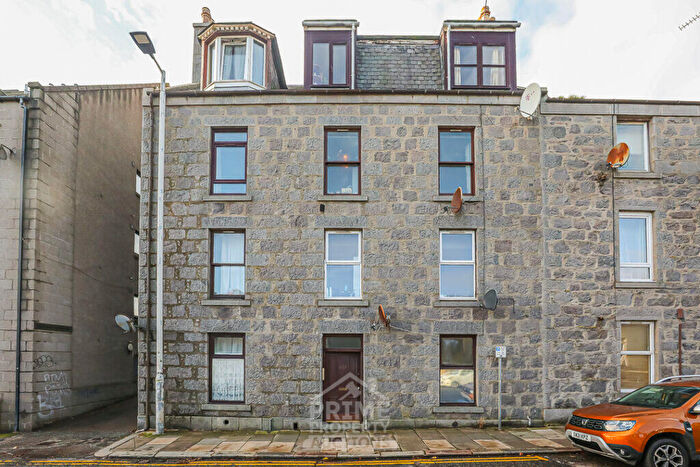
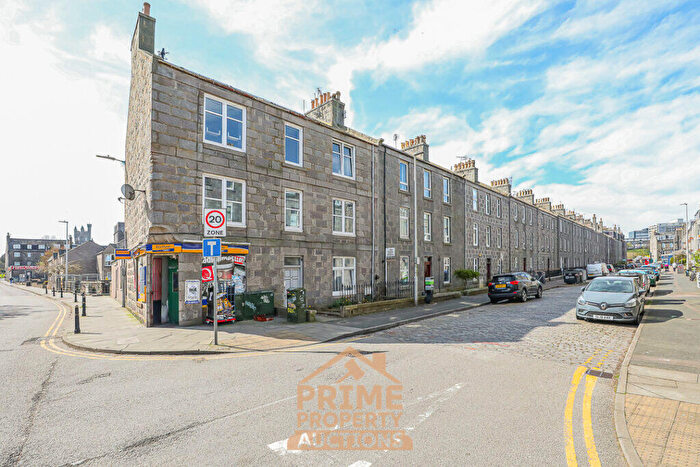
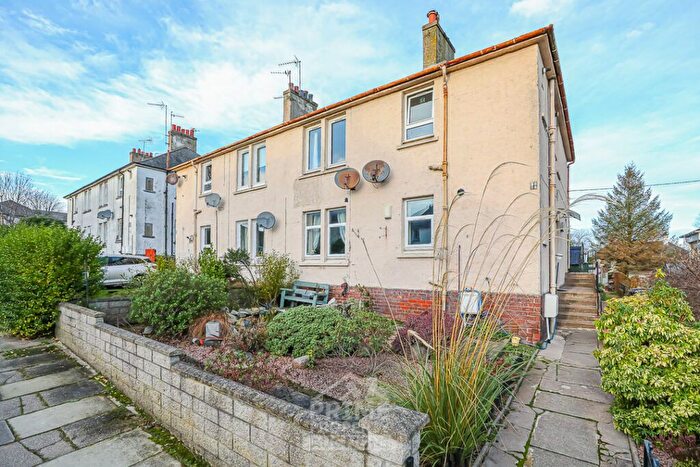
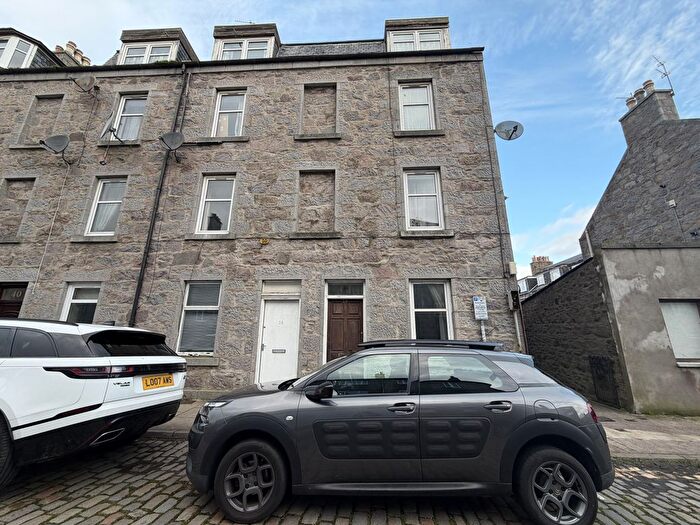
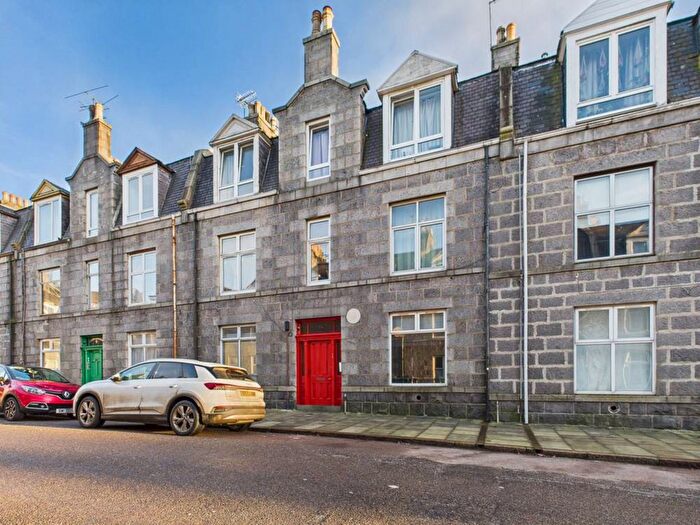
Houses for sale & to rent in Tillydrone/Seaton/Old Aberdeen, Aberdeen
House Prices in Tillydrone/Seaton/Old Aberdeen
Properties in Tillydrone/Seaton/Old Aberdeen have an average house price of £119,521.00 and had 164 Property Transactions within the last 3 years¹.
Tillydrone/Seaton/Old Aberdeen is an area in Aberdeen, Aberdeen City with 6,343 households², where the most expensive property was sold for £1,005,100.00.
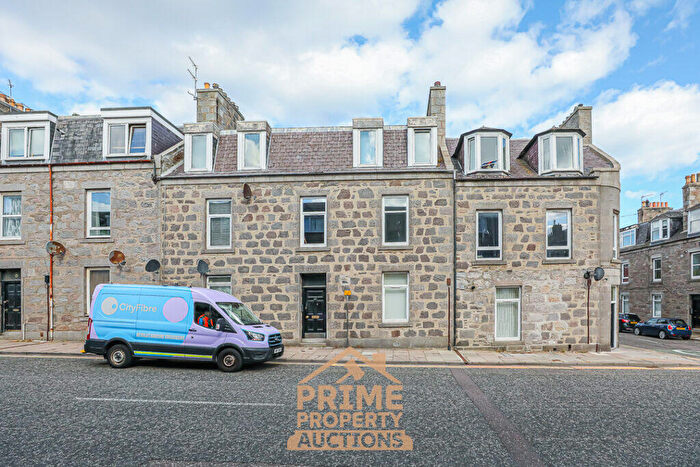
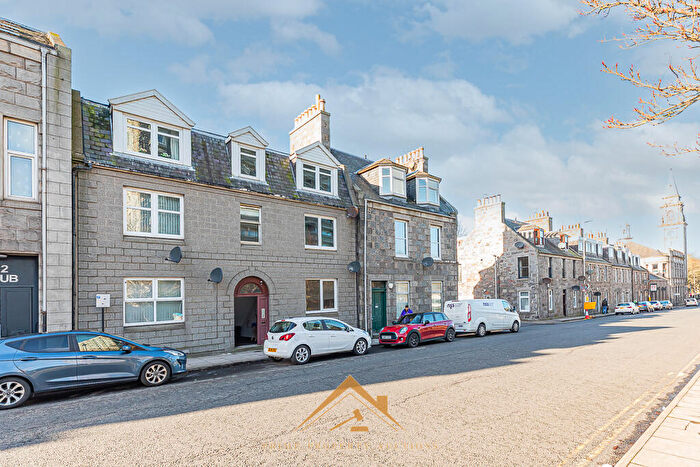
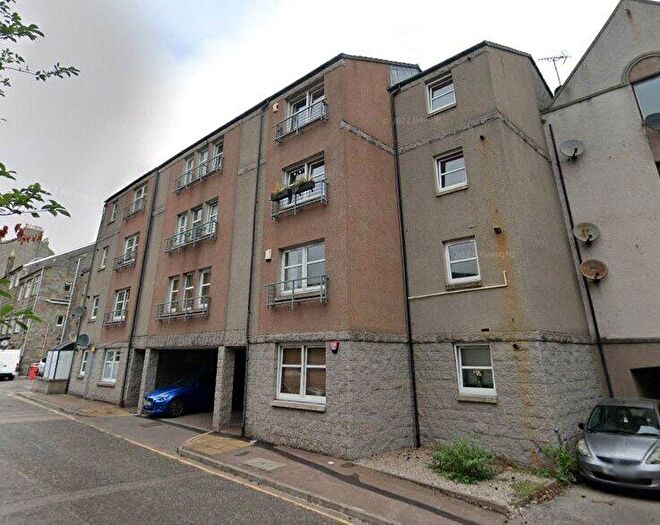
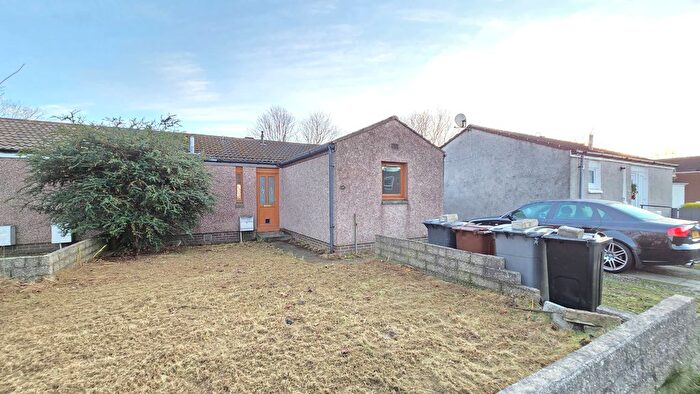
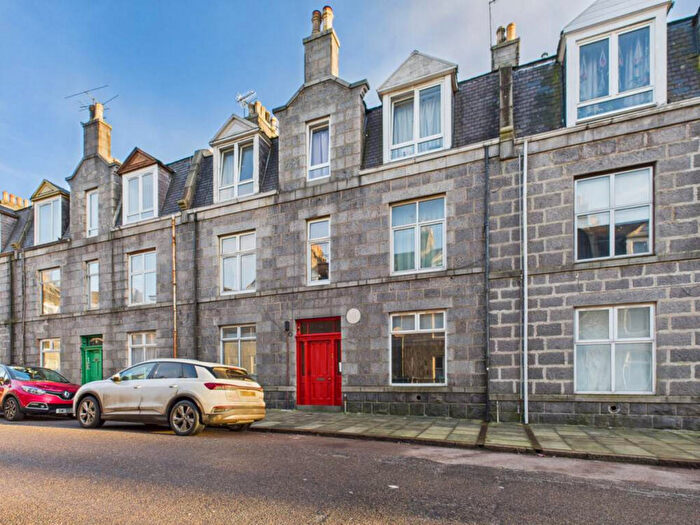
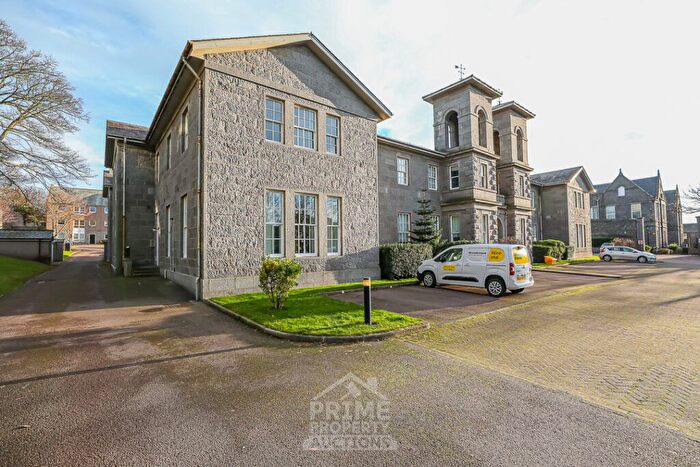
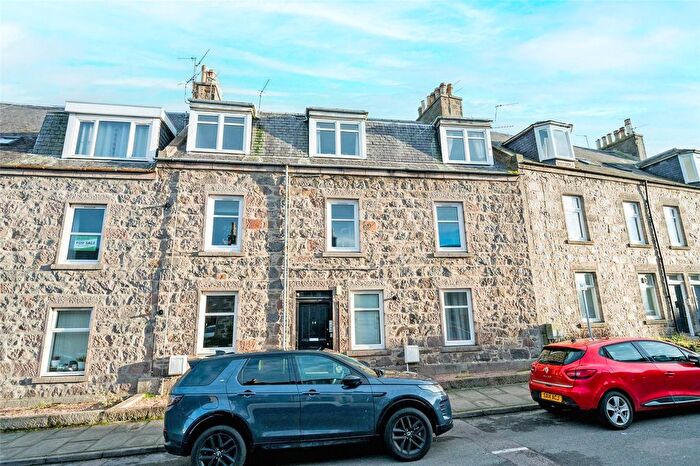
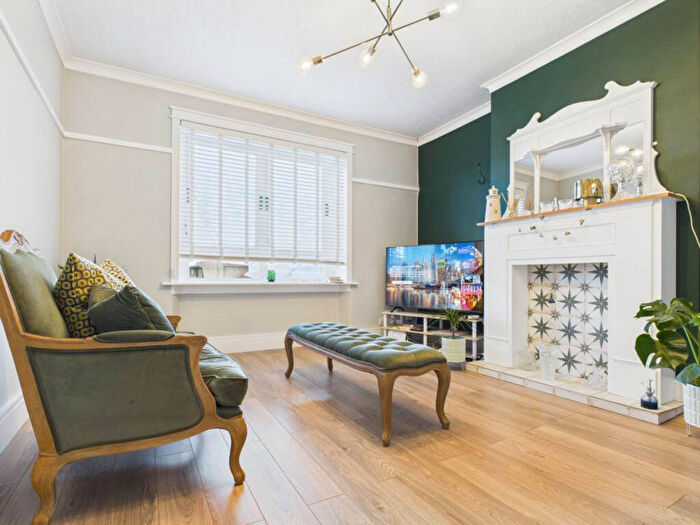
Properties for sale in Tillydrone/Seaton/Old Aberdeen
Roads and Postcodes in Tillydrone/Seaton/Old Aberdeen
Navigate through our locations to find the location of your next house in Tillydrone/Seaton/Old Aberdeen, Aberdeen for sale or to rent.
Transport near Tillydrone/Seaton/Old Aberdeen
- FAQ
- Price Paid By Year
Frequently asked questions about Tillydrone/Seaton/Old Aberdeen
What is the average price for a property for sale in Tillydrone/Seaton/Old Aberdeen?
The average price for a property for sale in Tillydrone/Seaton/Old Aberdeen is £119,521. This amount is 32% lower than the average price in Aberdeen. There are 1,392 property listings for sale in Tillydrone/Seaton/Old Aberdeen.
Which train stations are available in or near Tillydrone/Seaton/Old Aberdeen?
Some of the train stations available in or near Tillydrone/Seaton/Old Aberdeen are Aberdeen, Dyce and Portlethen.
Property Price Paid in Tillydrone/Seaton/Old Aberdeen by Year
The average sold property price by year was:
| Year | Average Sold Price | Price Change |
Sold Properties
|
|---|---|---|---|
| 2023 | £99,345 | -25% |
30 Properties |
| 2022 | £124,038 | 7% |
134 Properties |
| 2021 | £115,292 | -2% |
113 Properties |
| 2020 | £117,076 | -14% |
91 Properties |
| 2019 | £132,984 | -1% |
88 Properties |
| 2018 | £134,387 | -5% |
114 Properties |
| 2017 | £141,384 | 4% |
105 Properties |
| 2016 | £135,996 | -7% |
123 Properties |
| 2015 | £145,864 | 2% |
136 Properties |
| 2014 | £143,124 | 7% |
206 Properties |
| 2013 | £133,471 | 12% |
196 Properties |
| 2012 | £118,056 | -11% |
178 Properties |
| 2011 | £131,216 | 10% |
83 Properties |
| 2010 | £118,677 | 1% |
120 Properties |
| 2009 | £117,961 | 6% |
115 Properties |
| 2008 | £110,735 | -10% |
147 Properties |
| 2007 | £121,815 | -17% |
192 Properties |
| 2006 | £141,988 | 50% |
211 Properties |
| 2005 | £70,867 | -12% |
241 Properties |
| 2004 | £79,150 | 34% |
252 Properties |
| 2003 | £52,535 | -6% |
242 Properties |
| 2002 | £55,821 | -84% |
196 Properties |
| 2001 | £102,711 | - |
13 Properties |

