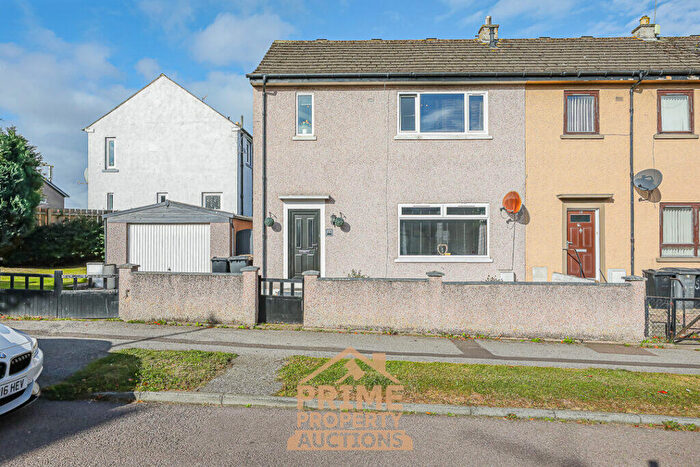
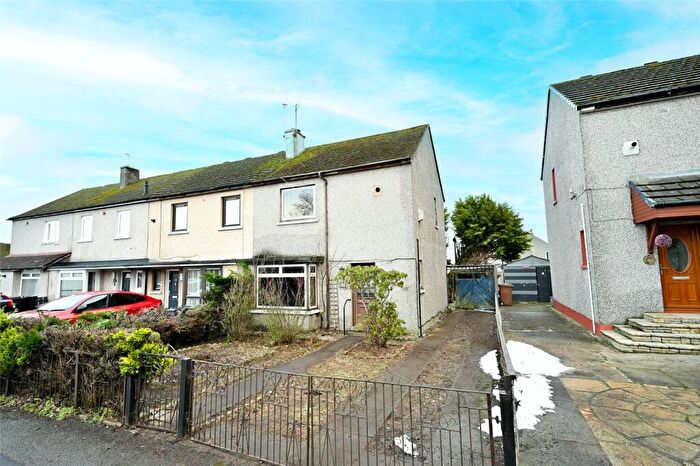
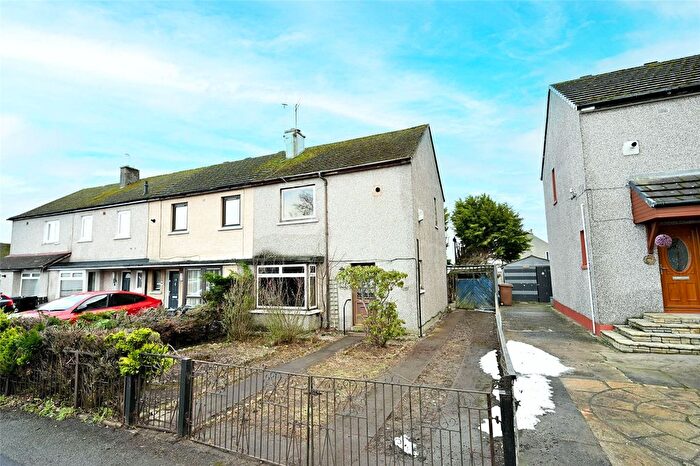
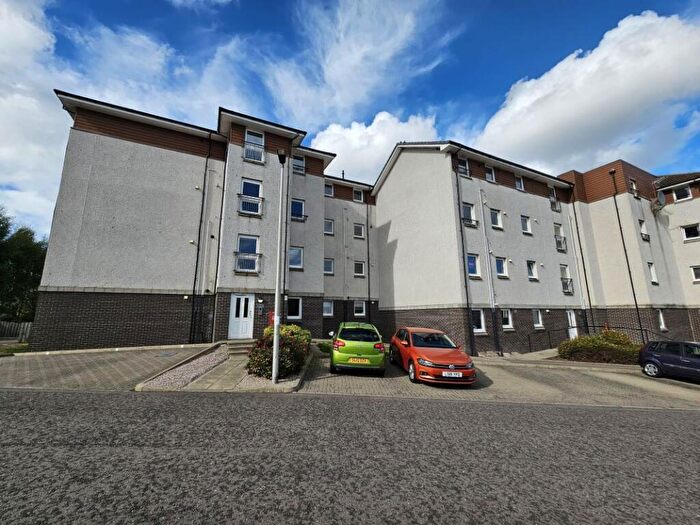
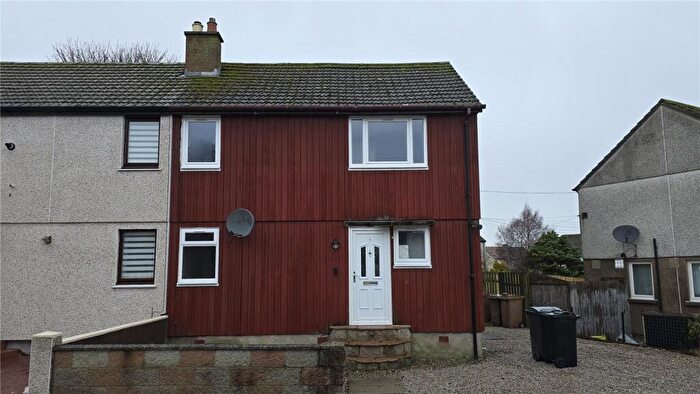
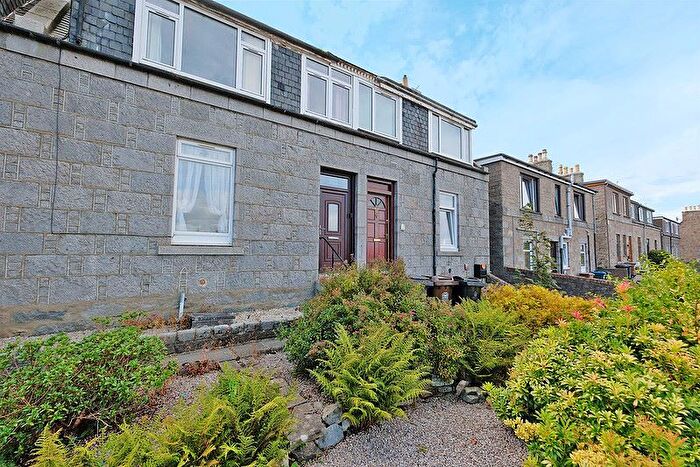
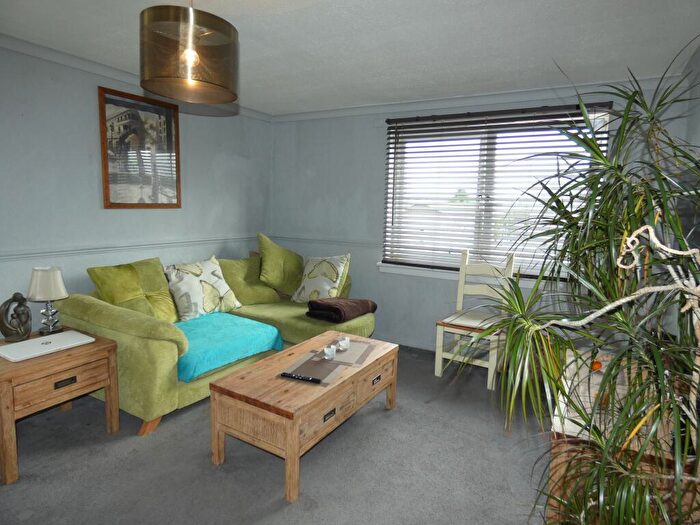
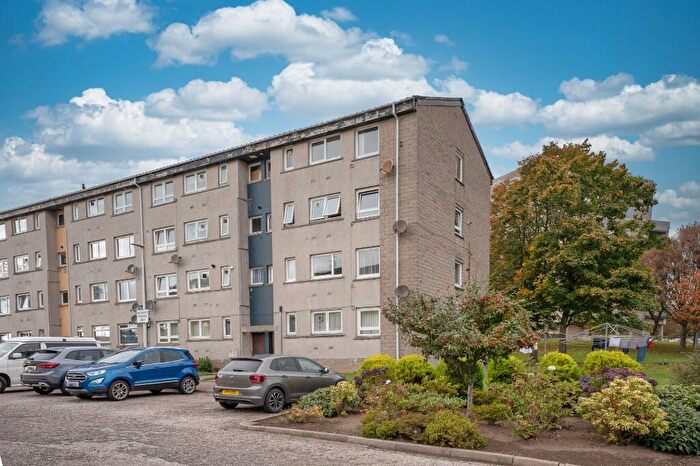
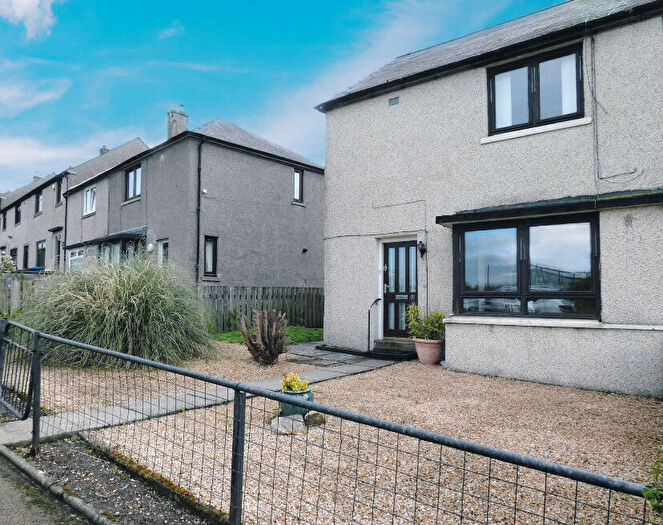
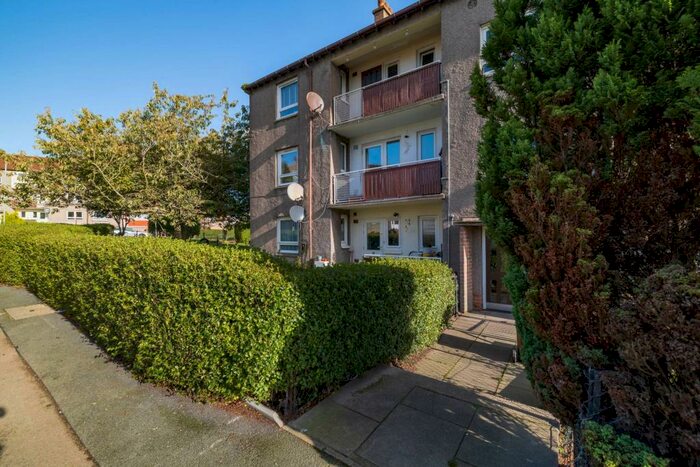
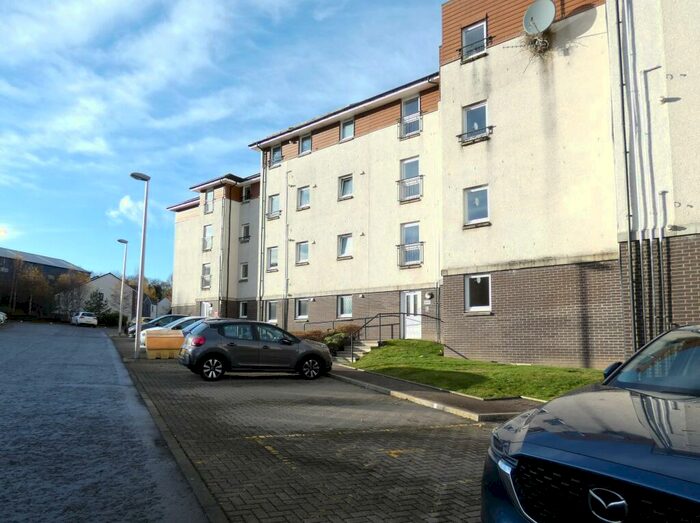
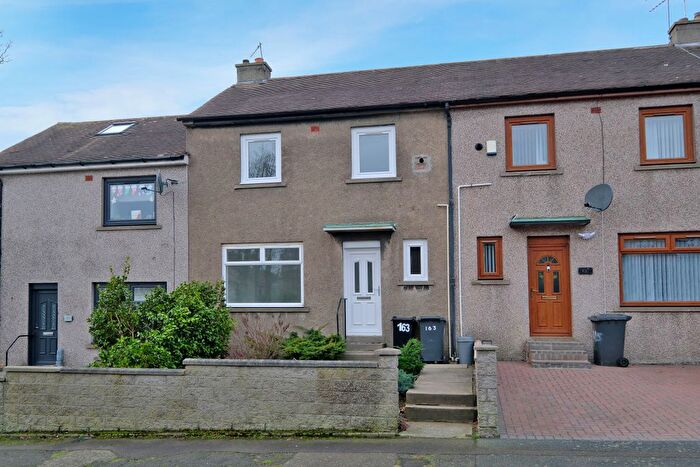
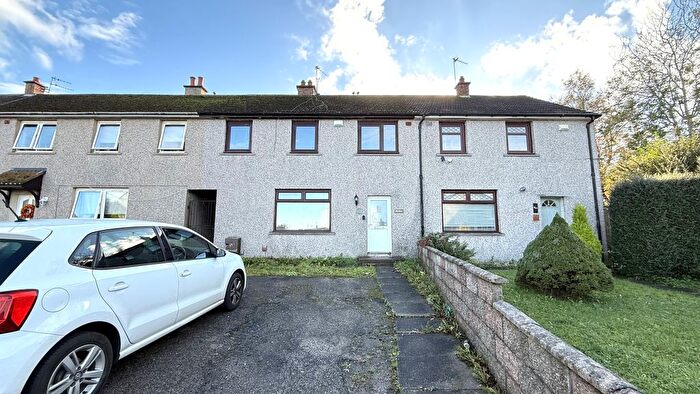
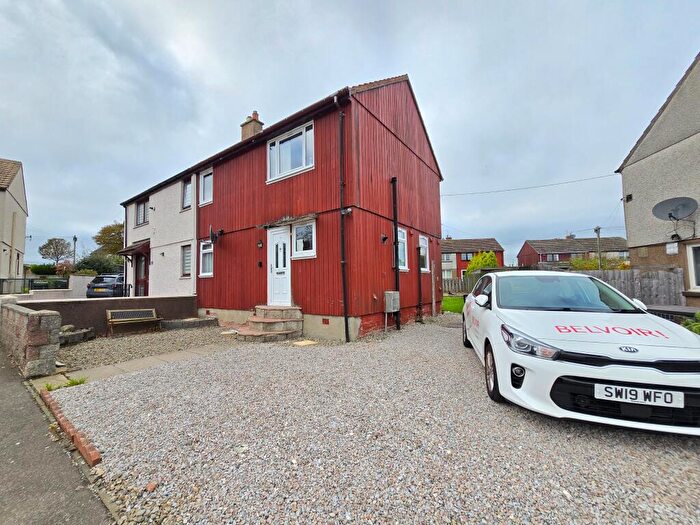
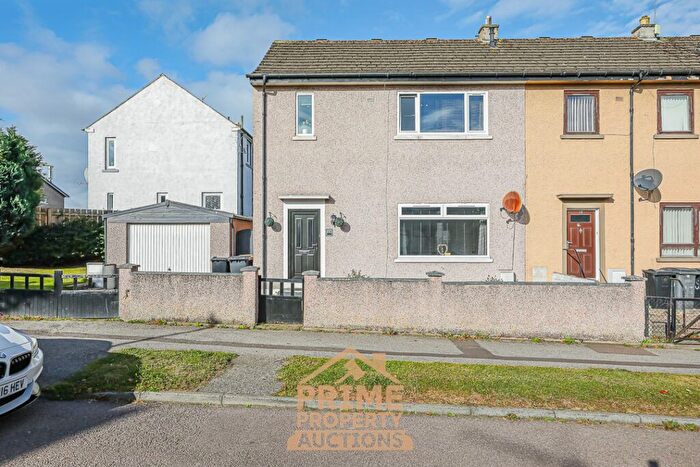
Houses for sale & to rent in Northfield/Mastrick North, Aberdeen
House Prices in Northfield/Mastrick North
Properties in Northfield/Mastrick North have an average house price of £123,327.00 and had 173 Property Transactions within the last 3 years¹.
Northfield/Mastrick North is an area in Aberdeen, Aberdeen City with 6,910 households², where the most expensive property was sold for £339,000.00.
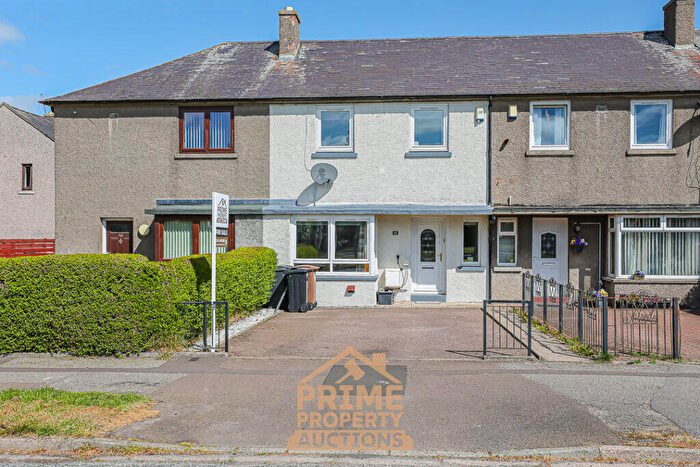
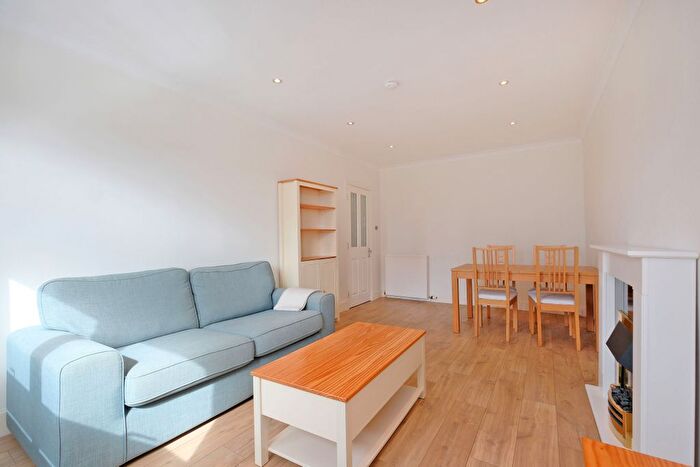
Properties for sale in Northfield/Mastrick North
Previously listed properties in Northfield/Mastrick North
Roads and Postcodes in Northfield/Mastrick North
Navigate through our locations to find the location of your next house in Northfield/Mastrick North, Aberdeen for sale or to rent.
Transport near Northfield/Mastrick North
- FAQ
- Price Paid By Year
Frequently asked questions about Northfield/Mastrick North
What is the average price for a property for sale in Northfield/Mastrick North?
The average price for a property for sale in Northfield/Mastrick North is £123,327. This amount is 30% lower than the average price in Aberdeen. There are 149 property listings for sale in Northfield/Mastrick North.
Which train stations are available in or near Northfield/Mastrick North?
Some of the train stations available in or near Northfield/Mastrick North are Aberdeen, Dyce and Portlethen.
Property Price Paid in Northfield/Mastrick North by Year
The average sold property price by year was:
| Year | Average Sold Price | Price Change |
Sold Properties
|
|---|---|---|---|
| 2023 | £114,394 | -9% |
25 Properties |
| 2022 | £124,837 | -4% |
148 Properties |
| 2021 | £129,302 | 8% |
150 Properties |
| 2020 | £118,495 | -9% |
113 Properties |
| 2019 | £129,268 | 0,2% |
132 Properties |
| 2018 | £129,027 | 1% |
152 Properties |
| 2017 | £127,780 | -6% |
137 Properties |
| 2016 | £135,434 | -7% |
158 Properties |
| 2015 | £144,329 | 10% |
199 Properties |
| 2014 | £130,236 | 9% |
187 Properties |
| 2013 | £117,984 | 9% |
166 Properties |
| 2012 | £107,914 | -2% |
151 Properties |
| 2011 | £110,596 | 5% |
145 Properties |
| 2010 | £105,471 | 12% |
152 Properties |
| 2009 | £92,816 | -12% |
158 Properties |
| 2008 | £104,104 | 12% |
201 Properties |
| 2007 | £92,075 | 23% |
247 Properties |
| 2006 | £70,457 | 23% |
242 Properties |
| 2005 | £54,406 | 13% |
249 Properties |
| 2004 | £47,289 | 16% |
244 Properties |
| 2003 | £39,848 | 9% |
275 Properties |
| 2002 | £36,246 | 15% |
278 Properties |
| 2001 | £30,633 | - |
16 Properties |

