
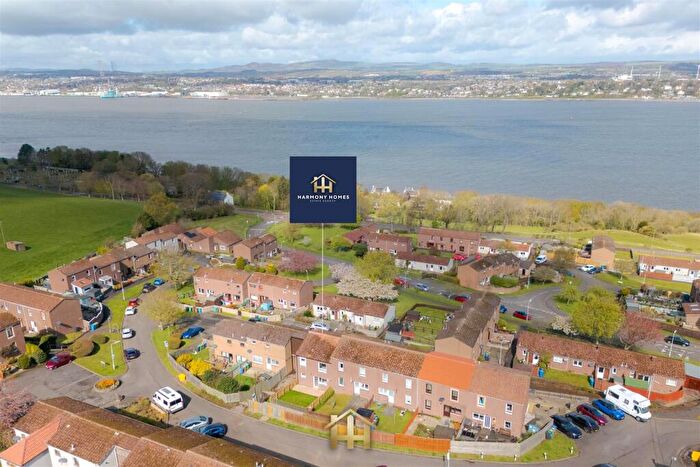
Houses for sale & to rent in Newport-on-tay, Fife
House Prices in Newport-on-tay
Properties in Newport-on-tay have an average house price of £216k and had 241 Property Transactions within the last 3 years.¹
Newport-on-tay is an area in Fife with 4,149 households², where the most expensive property was sold for £776k.
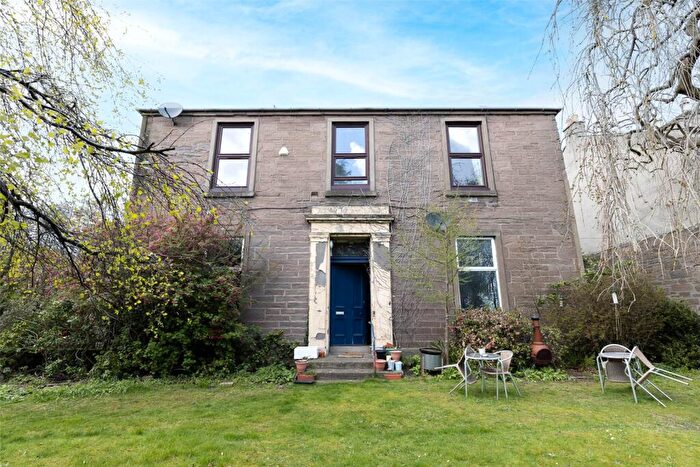
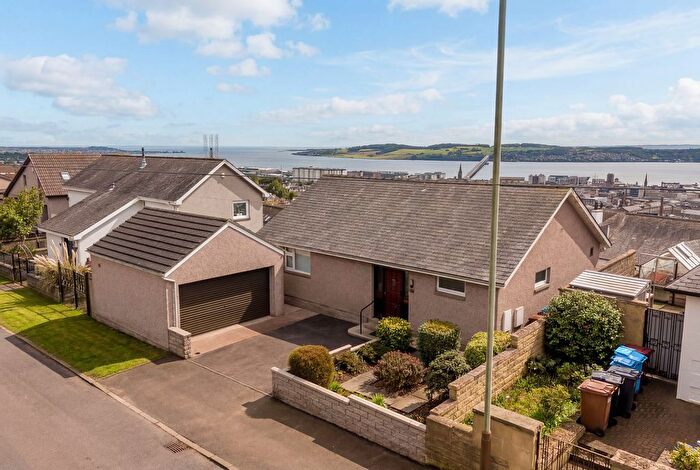
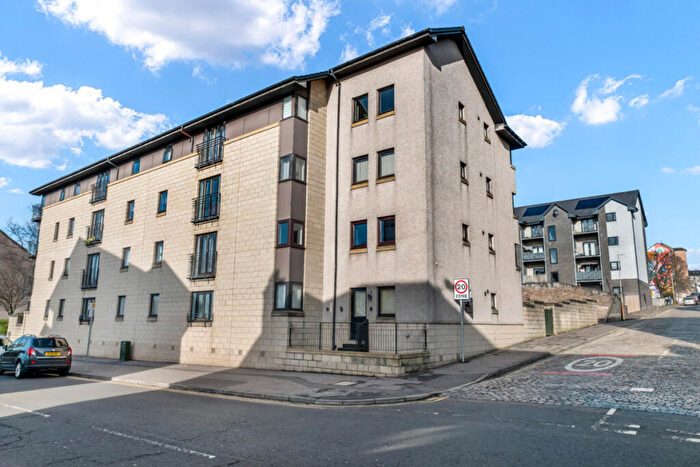
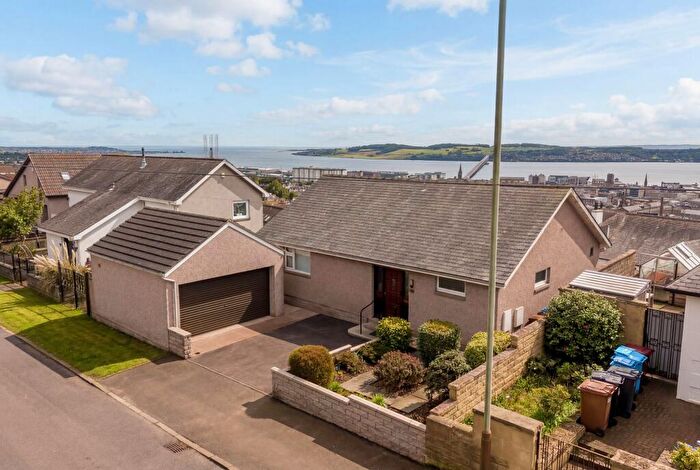
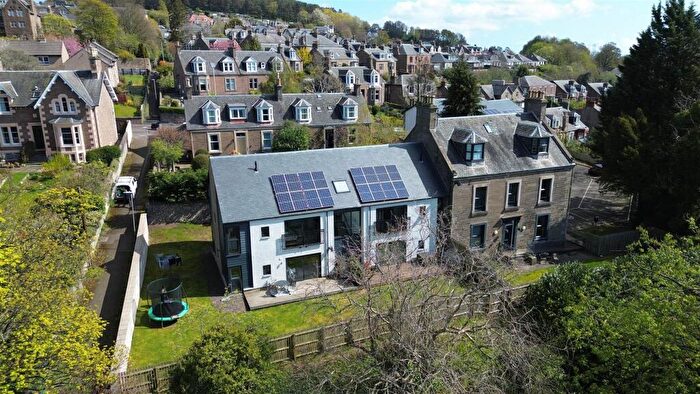
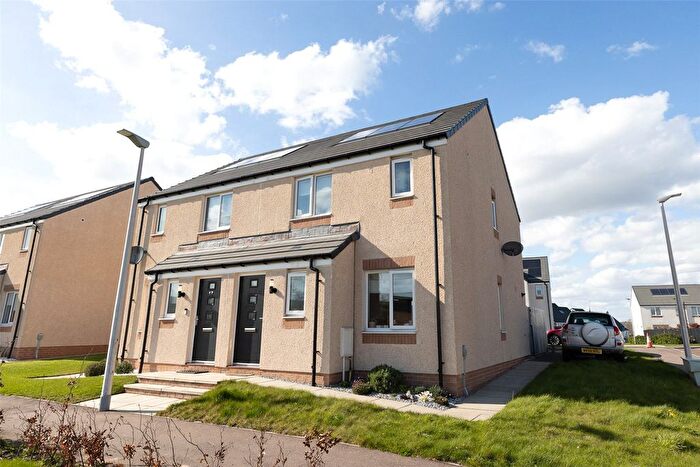
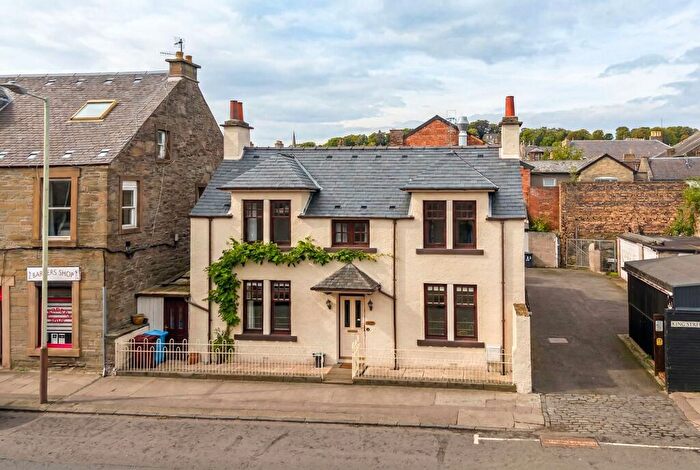
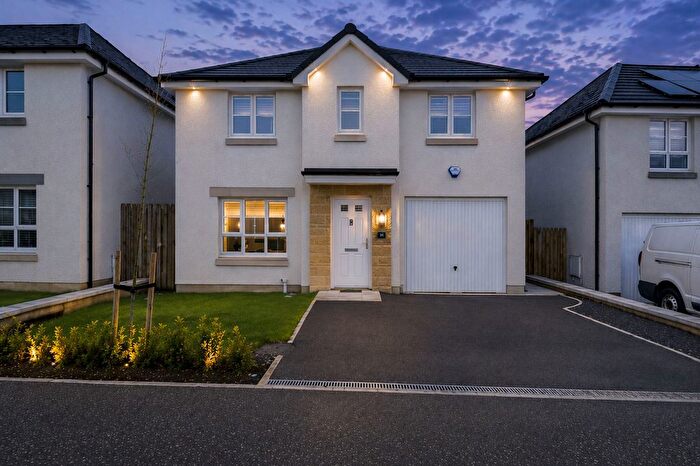
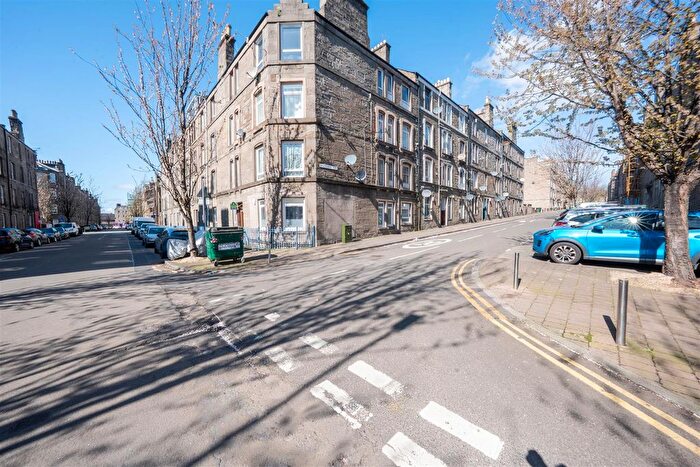
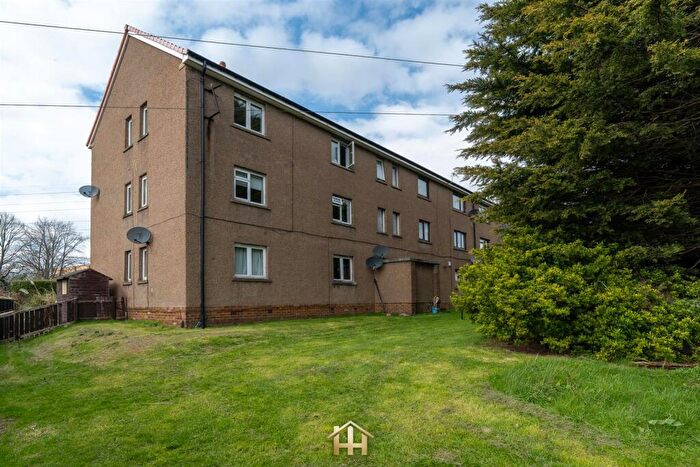
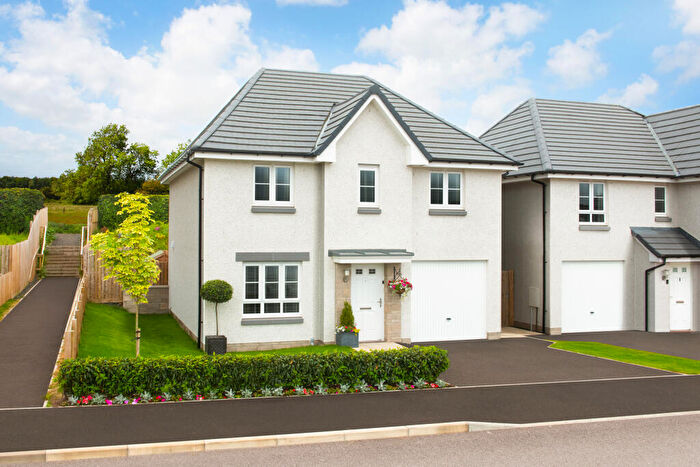
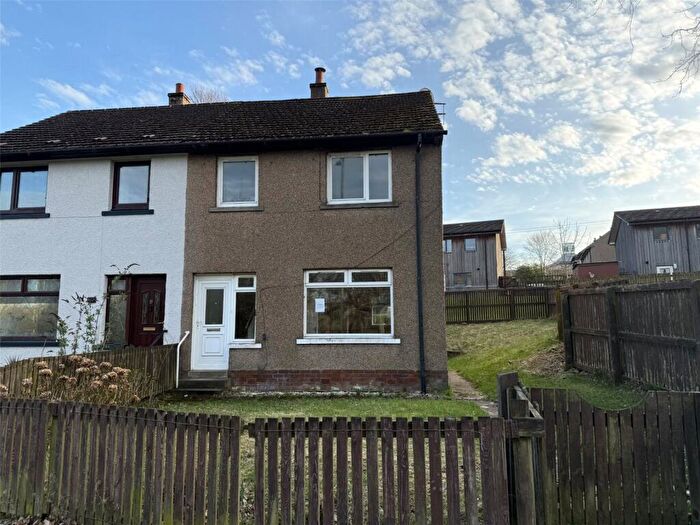
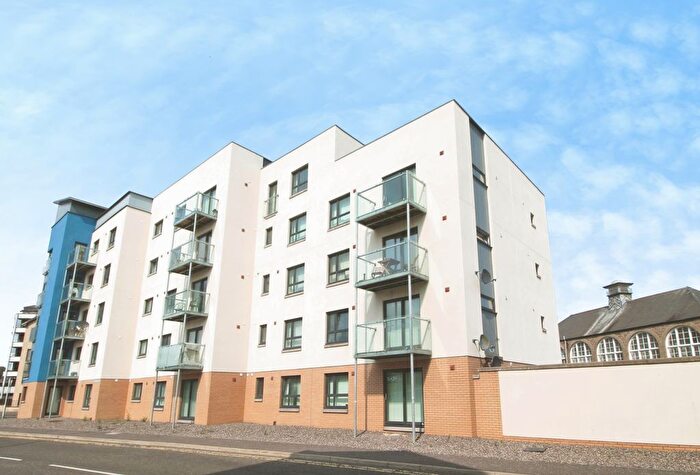
Properties for sale in Newport-on-tay


![]()
If you are looking to sell your house, let it out, or receive a property valuation, an expert can help you.
Click the button below to get started.


Neighbourhoods in Newport-on-tay
Navigate through our locations to find the location of your next house in Newport-on-tay, Fife for sale or to rent.
Transport in Newport-on-tay
Please see below transportation links in this area:

- FAQ
- Price Paid By Year
Frequently asked questions about Newport-on-tay
What is the average price for a property for sale in Newport-on-tay?
The average price for a property for sale in Newport-on-tay is £215,803. This amount is 18% higher than the average price in Fife. There are 3,023 property listings for sale in Newport-on-tay.
Which train stations are available in or near Newport-on-tay?
Some of the train stations available in or near Newport-on-tay are Dundee, Broughty Ferry and Balmossie.
Property Price Paid in Newport-on-tay by Year
The average sold property price by year was:
| Year | Average Sold Price | Price Change |
Sold Properties
|
|---|---|---|---|
| 2025 | £210,457 | -1% |
78 Properties |
| 2024 | £213,100 | -5% |
76 Properties |
| 2023 | £222,957 | -4% |
87 Properties |
| 2022 | £231,495 | 9% |
139 Properties |
| 2021 | £210,988 | -2% |
199 Properties |
| 2020 | £215,601 | 11% |
144 Properties |
| 2019 | £191,315 | -3% |
205 Properties |
| 2018 | £197,660 | 7% |
171 Properties |
| 2017 | £182,869 | -9% |
181 Properties |
| 2016 | £198,921 | 10% |
167 Properties |
| 2015 | £179,836 | 4% |
182 Properties |
| 2014 | £171,862 | 1% |
188 Properties |
| 2013 | £169,704 | -7% |
128 Properties |
| 2012 | £182,385 | 14% |
113 Properties |
| 2011 | £157,303 | -8% |
113 Properties |
| 2010 | £170,140 | 10% |
109 Properties |
| 2009 | £153,359 | 7% |
121 Properties |
| 2008 | £142,226 | -27% |
192 Properties |
| 2007 | £180,718 | 23% |
208 Properties |
| 2006 | £139,991 | 13% |
205 Properties |
| 2005 | £121,605 | 13% |
205 Properties |
| 2004 | £105,701 | 22% |
220 Properties |
| 2003 | £82,776 | 8% |
229 Properties |
| 2002 | £76,469 | 22% |
193 Properties |
| 2001 | £59,782 | - |
15 Properties |