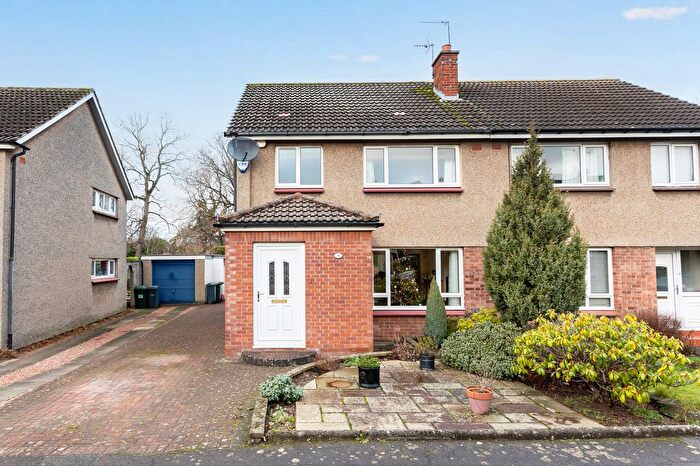
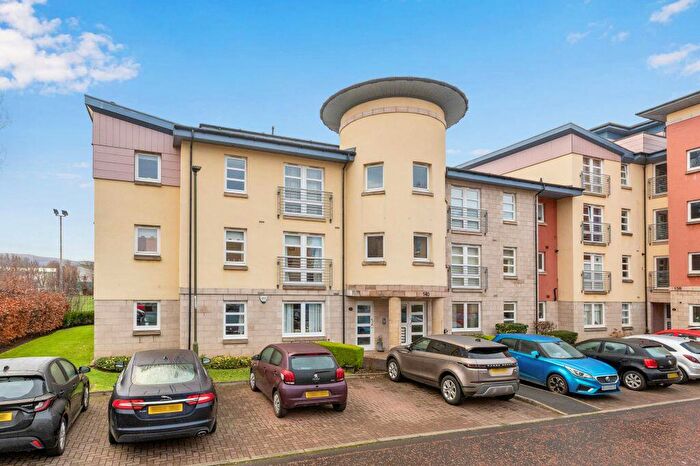
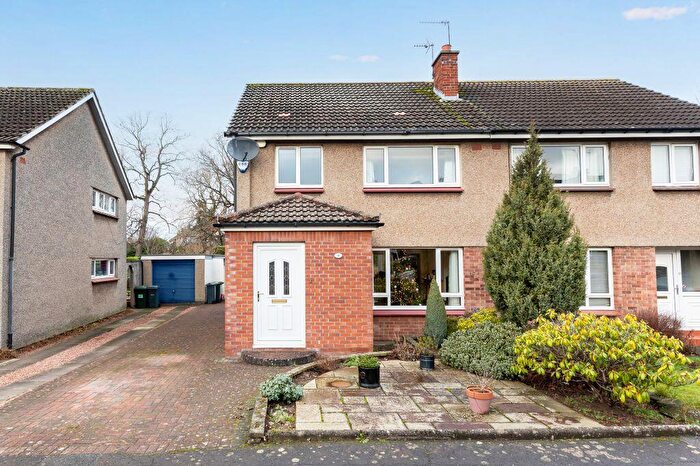
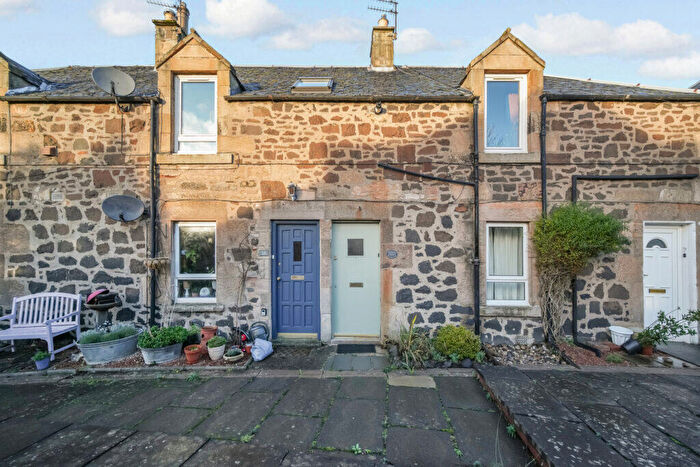
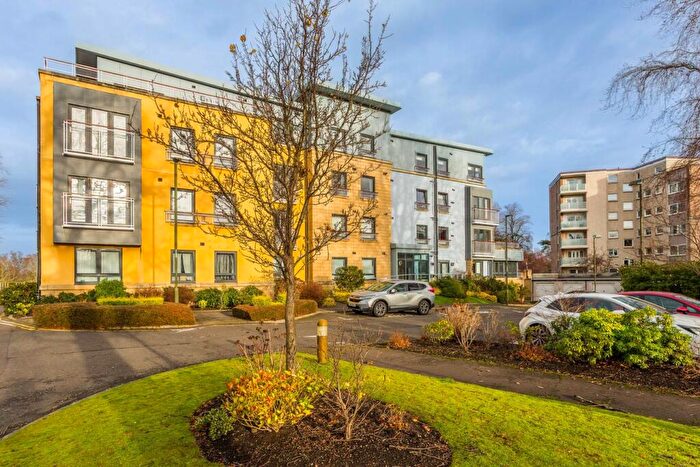
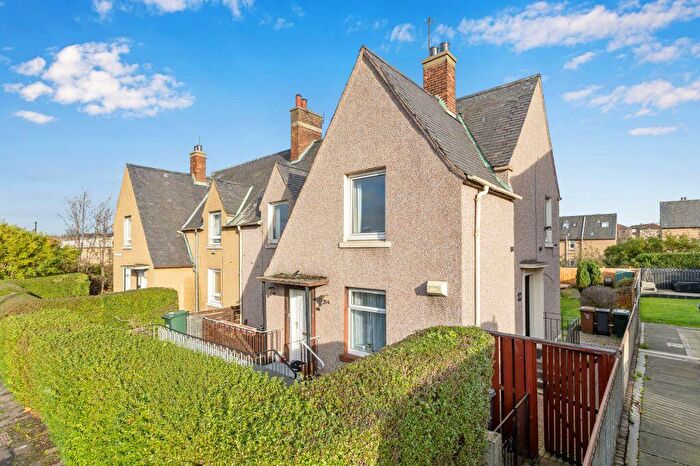
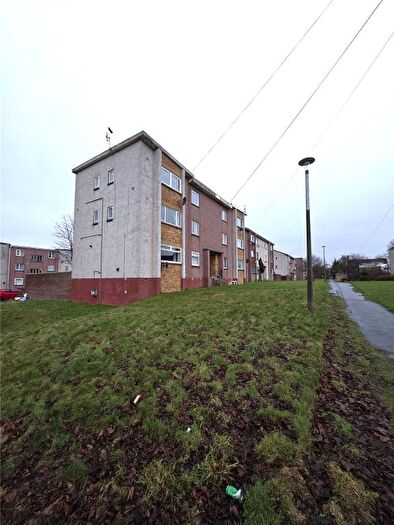
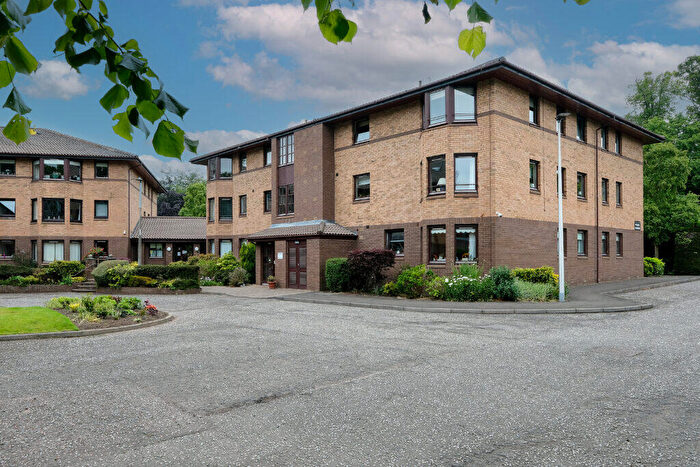
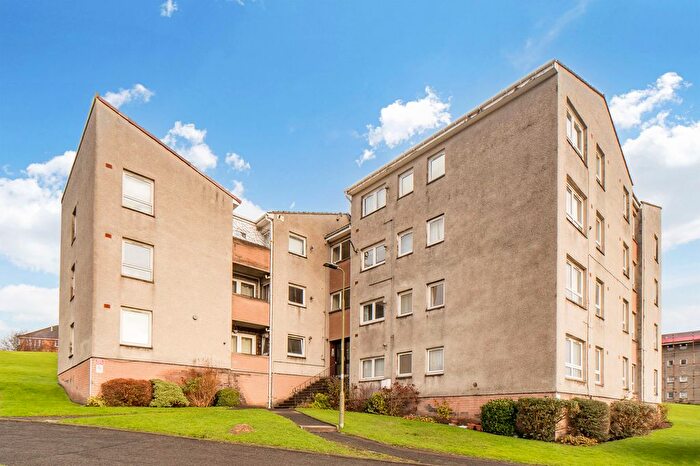
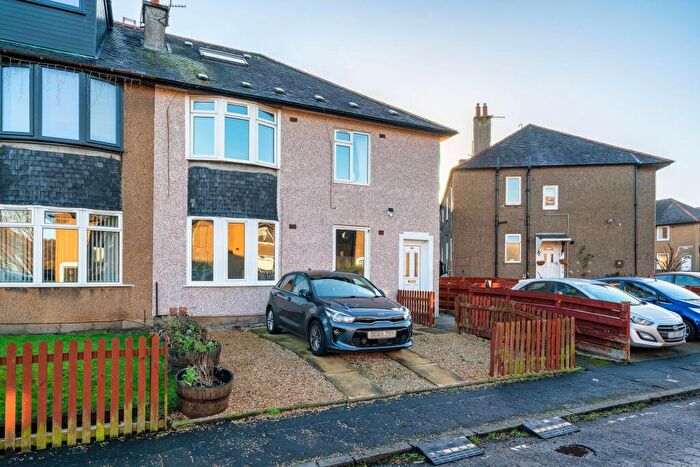
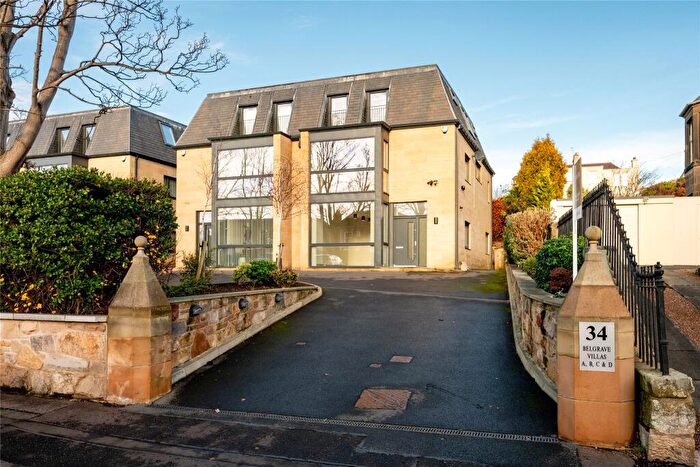
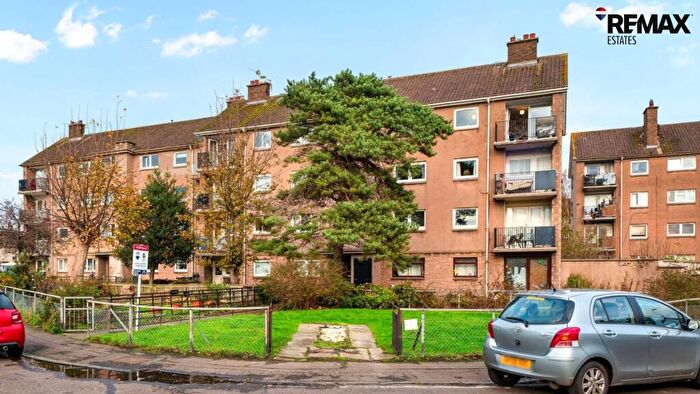
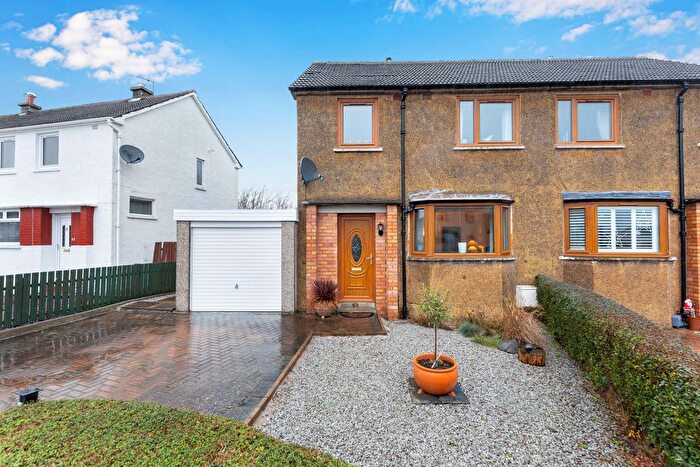
Houses for sale & to rent in Drum Brae/Gyle, Edinburgh
House Prices in Drum Brae/Gyle
Properties in Drum Brae/Gyle have an average house price of £294,365.00 and had 561 Property Transactions within the last 3 years¹.
Drum Brae/Gyle is an area in Edinburgh, City of Edinburgh with 9,830 households², where the most expensive property was sold for £1,100,000.00.
Properties for sale in Drum Brae/Gyle
Roads and Postcodes in Drum Brae/Gyle
Navigate through our locations to find the location of your next house in Drum Brae/Gyle, Edinburgh for sale or to rent.
Transport near Drum Brae/Gyle
-
South Gyle Station
-
Edinburgh Gateway Station
-
Edinburgh Park Station
-
Wester Hailes Station
-
Kingsknowe Station
-
Slateford Station
- FAQ
- Price Paid By Year
Frequently asked questions about Drum Brae/Gyle
What is the average price for a property for sale in Drum Brae/Gyle?
The average price for a property for sale in Drum Brae/Gyle is £294,365. This amount is 12% lower than the average price in Edinburgh. There are 2,677 property listings for sale in Drum Brae/Gyle.
Which train stations are available in or near Drum Brae/Gyle?
Some of the train stations available in or near Drum Brae/Gyle are South Gyle, Edinburgh Gateway and Edinburgh Park.
Property Price Paid in Drum Brae/Gyle by Year
The average sold property price by year was:
| Year | Average Sold Price | Price Change |
Sold Properties
|
|---|---|---|---|
| 2023 | £322,653 | 10% |
83 Properties |
| 2022 | £289,453 | 16% |
478 Properties |
| 2021 | £244,562 | 1% |
611 Properties |
| 2020 | £242,505 | 6% |
353 Properties |
| 2019 | £228,946 | -0,2% |
507 Properties |
| 2018 | £229,444 | 6% |
488 Properties |
| 2017 | £216,306 | 9% |
582 Properties |
| 2016 | £195,931 | -9% |
561 Properties |
| 2015 | £212,805 | 13% |
488 Properties |
| 2014 | £184,298 | -5% |
443 Properties |
| 2013 | £192,804 | -2% |
404 Properties |
| 2012 | £195,732 | 10% |
344 Properties |
| 2011 | £176,589 | -9% |
336 Properties |
| 2010 | £192,548 | -8% |
292 Properties |
| 2009 | £207,263 | -108% |
283 Properties |
| 2008 | £431,355 | 59% |
400 Properties |
| 2007 | £178,744 | -4% |
564 Properties |
| 2006 | £185,694 | 4% |
624 Properties |
| 2005 | £179,122 | 20% |
591 Properties |
| 2004 | £144,176 | 18% |
579 Properties |
| 2003 | £117,915 | 2% |
636 Properties |
| 2002 | £116,128 | 19% |
627 Properties |
| 2001 | £93,580 | 21% |
77 Properties |
| 2000 | £74,094 | - |
38 Properties |

