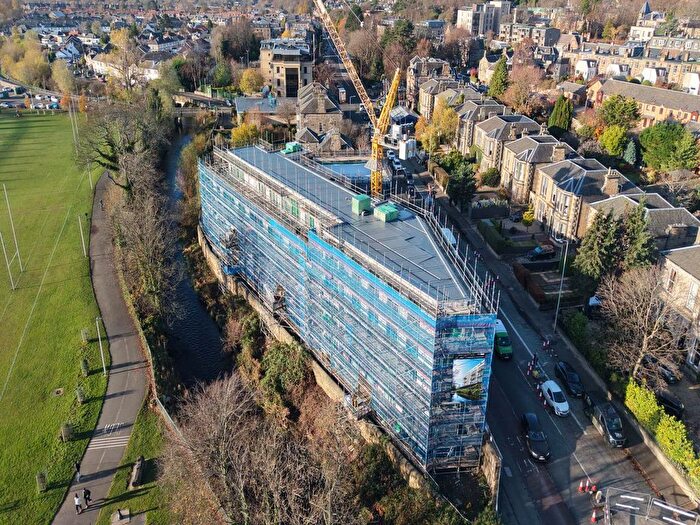
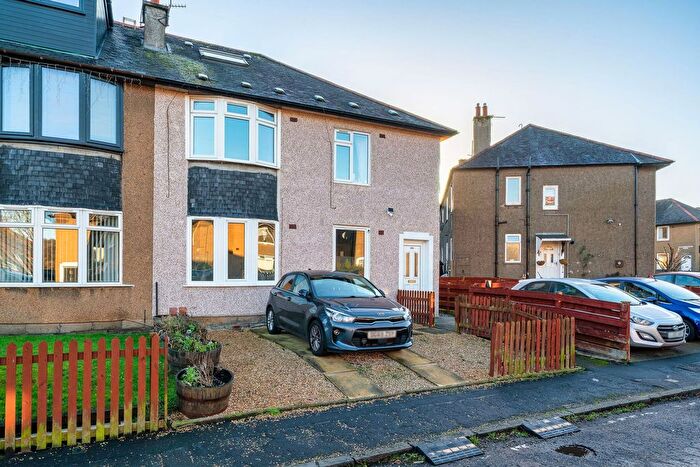
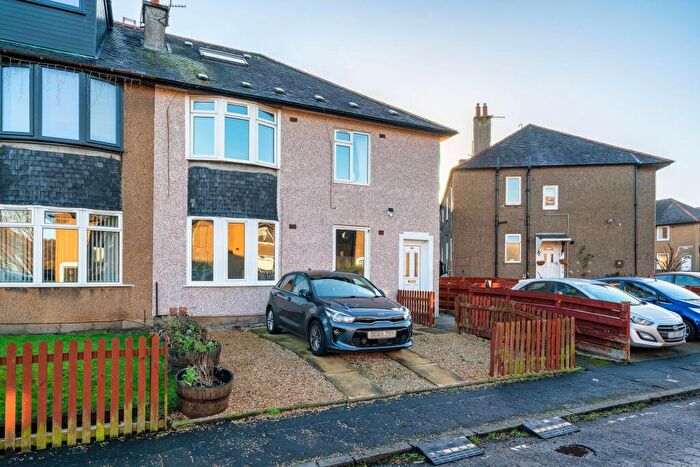
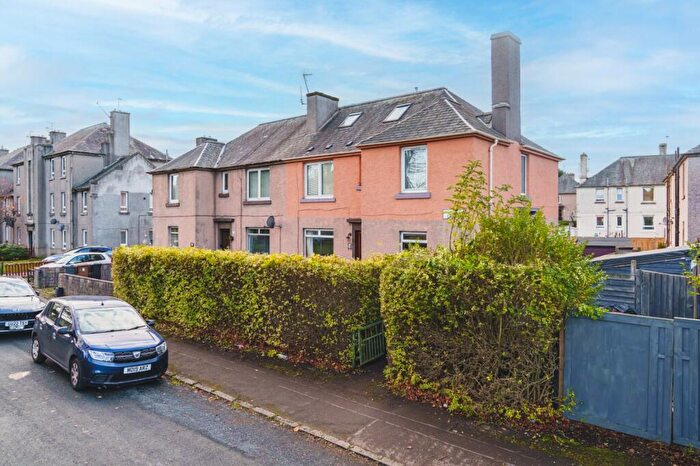
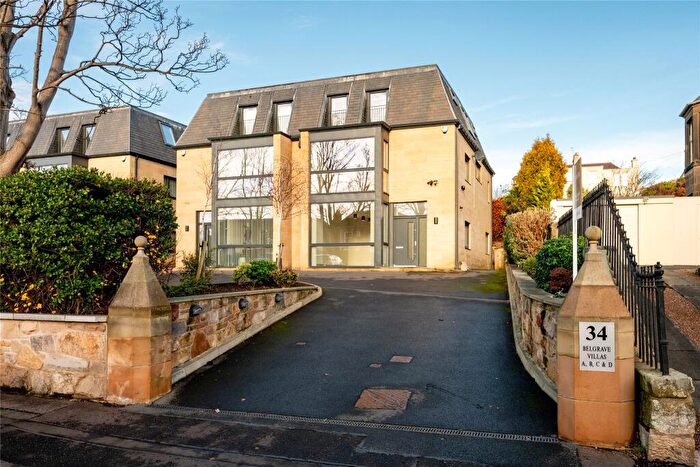
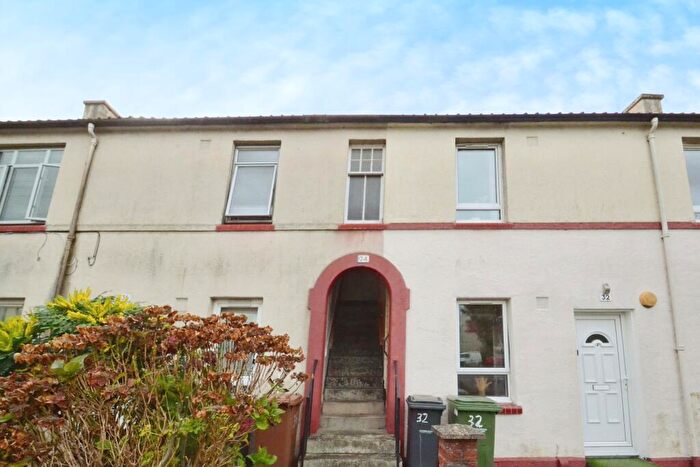
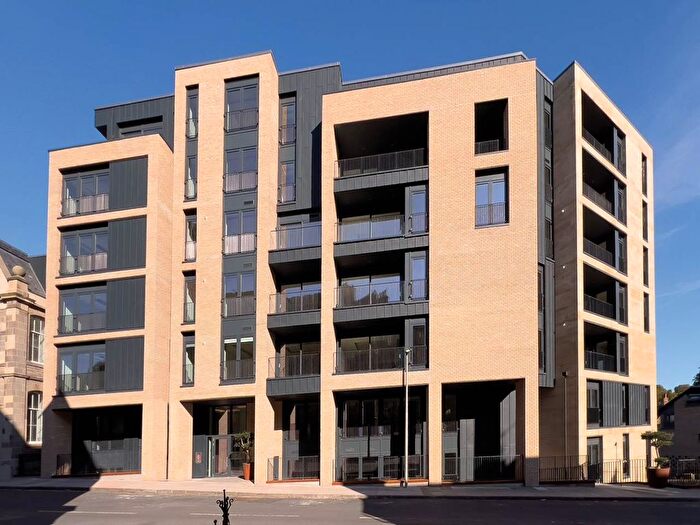
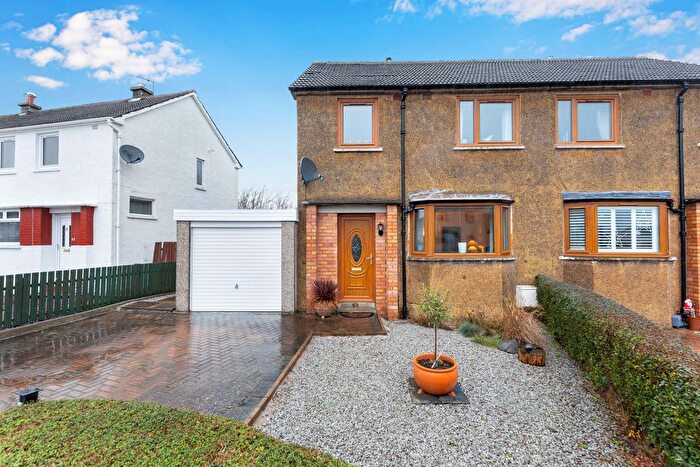
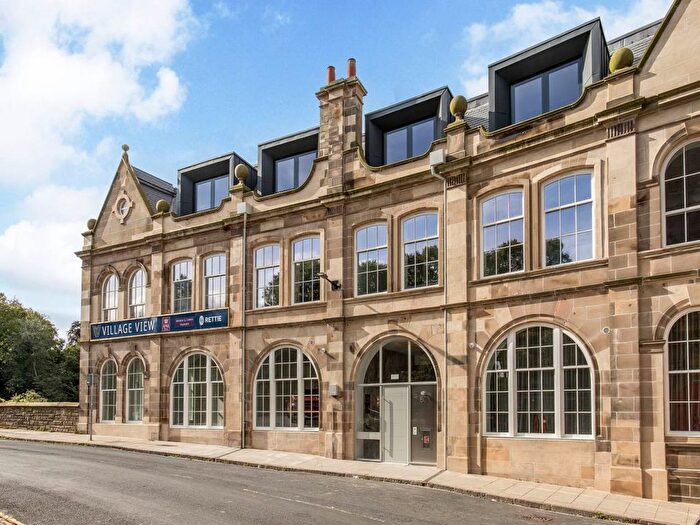
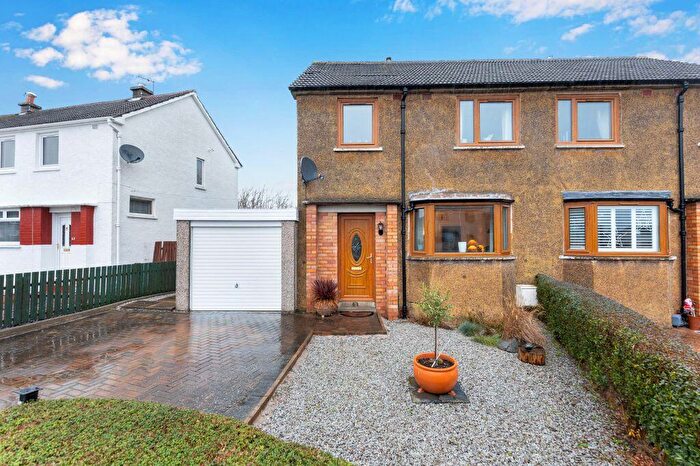
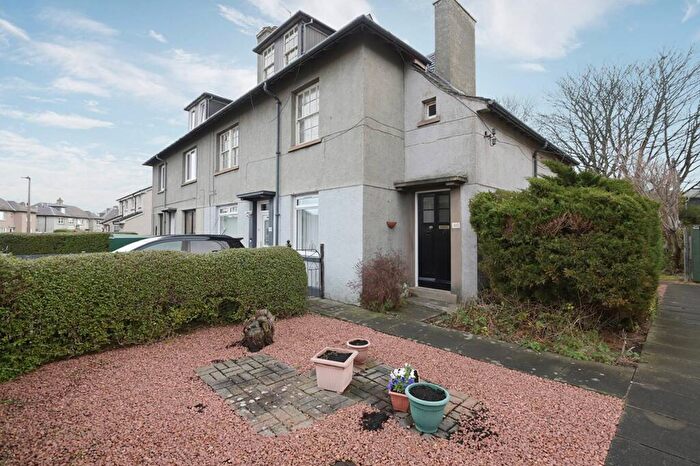
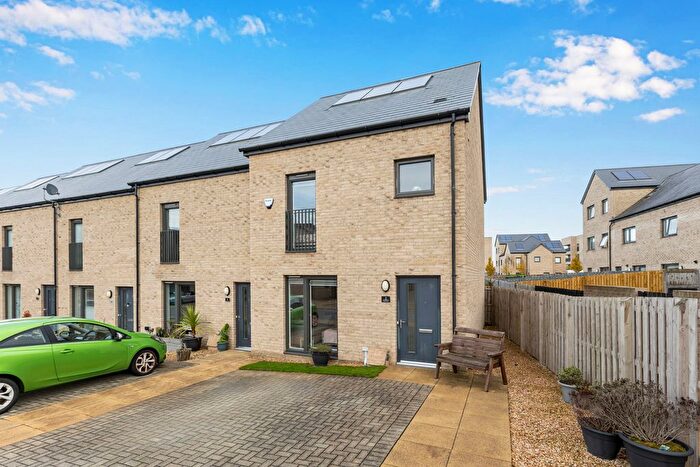
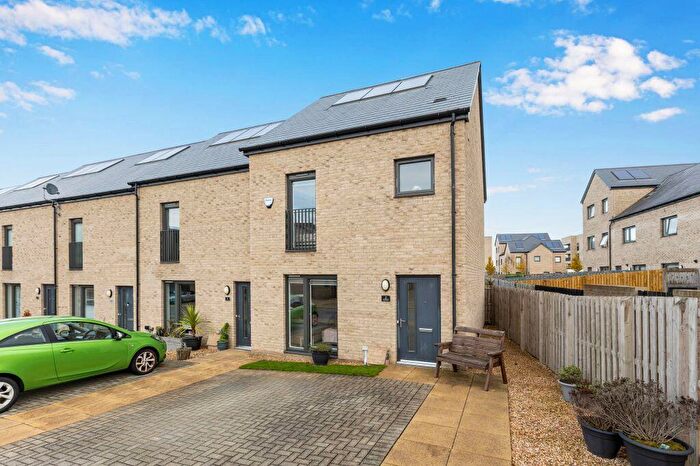
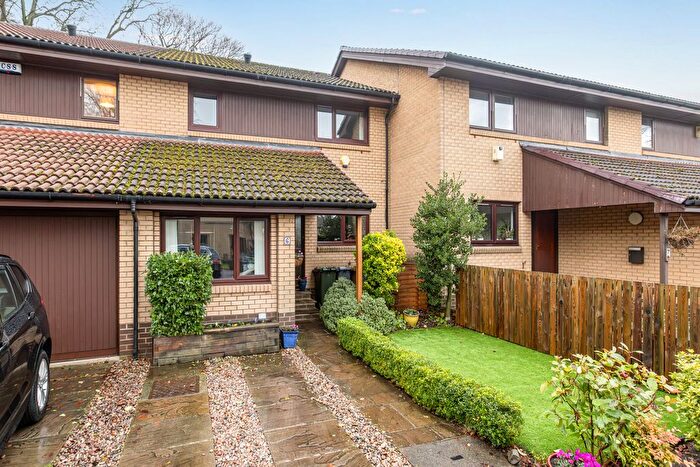
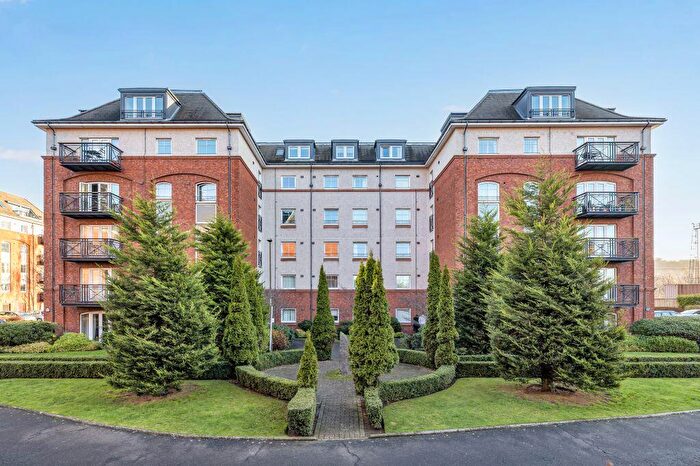
Houses for sale & to rent in Corstorphine/Murrayfield, Edinburgh
House Prices in Corstorphine/Murrayfield
Properties in Corstorphine/Murrayfield have an average house price of £388,948.00 and had 575 Property Transactions within the last 3 years¹.
Corstorphine/Murrayfield is an area in Edinburgh, City of Edinburgh with 10,654 households², where the most expensive property was sold for £1,860,000.00.
Properties for sale in Corstorphine/Murrayfield
Roads and Postcodes in Corstorphine/Murrayfield
Navigate through our locations to find the location of your next house in Corstorphine/Murrayfield, Edinburgh for sale or to rent.
Transport near Corstorphine/Murrayfield
-
Slateford Station
-
South Gyle Station
-
Kingsknowe Station
-
Haymarket Station
-
Edinburgh Park Station
-
Wester Hailes Station
-
Edinburgh Gateway Station
-
Edinburgh Station
- FAQ
- Price Paid By Year
Frequently asked questions about Corstorphine/Murrayfield
What is the average price for a property for sale in Corstorphine/Murrayfield?
The average price for a property for sale in Corstorphine/Murrayfield is £388,948. This amount is 16% higher than the average price in Edinburgh. There are 3,064 property listings for sale in Corstorphine/Murrayfield.
Which train stations are available in or near Corstorphine/Murrayfield?
Some of the train stations available in or near Corstorphine/Murrayfield are Slateford, South Gyle and Kingsknowe.
Property Price Paid in Corstorphine/Murrayfield by Year
The average sold property price by year was:
| Year | Average Sold Price | Price Change |
Sold Properties
|
|---|---|---|---|
| 2023 | £412,923 | 7% |
87 Properties |
| 2022 | £384,674 | 2% |
488 Properties |
| 2021 | £378,820 | 5% |
535 Properties |
| 2020 | £359,241 | 6% |
422 Properties |
| 2019 | £336,536 | 1% |
516 Properties |
| 2018 | £332,463 | 8% |
504 Properties |
| 2017 | £305,592 | 8% |
575 Properties |
| 2016 | £281,444 | -4% |
577 Properties |
| 2015 | £292,648 | -2% |
630 Properties |
| 2014 | £299,532 | 17% |
527 Properties |
| 2013 | £248,557 | -6% |
439 Properties |
| 2012 | £264,405 | -11% |
398 Properties |
| 2011 | £292,856 | 3% |
361 Properties |
| 2010 | £284,752 | 2% |
357 Properties |
| 2009 | £280,046 | 8% |
336 Properties |
| 2008 | £258,524 | -14% |
367 Properties |
| 2007 | £293,918 | 15% |
564 Properties |
| 2006 | £248,411 | 4% |
670 Properties |
| 2005 | £238,524 | 2% |
589 Properties |
| 2004 | £234,029 | 12% |
667 Properties |
| 2003 | £205,075 | 19% |
709 Properties |
| 2002 | £166,144 | 9% |
743 Properties |
| 2001 | £151,979 | 9% |
81 Properties |
| 2000 | £137,735 | - |
38 Properties |

