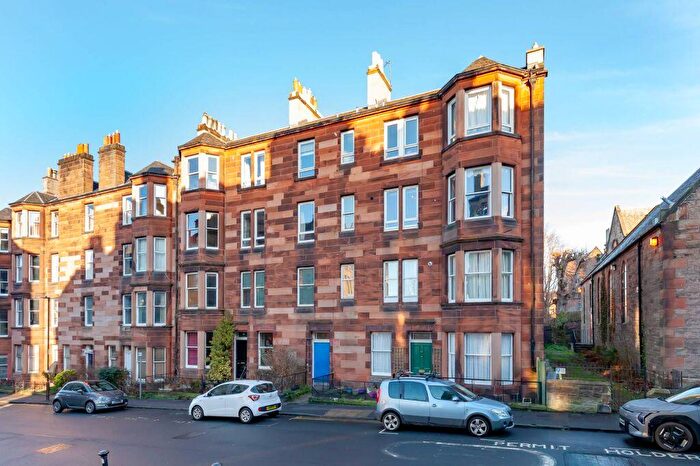
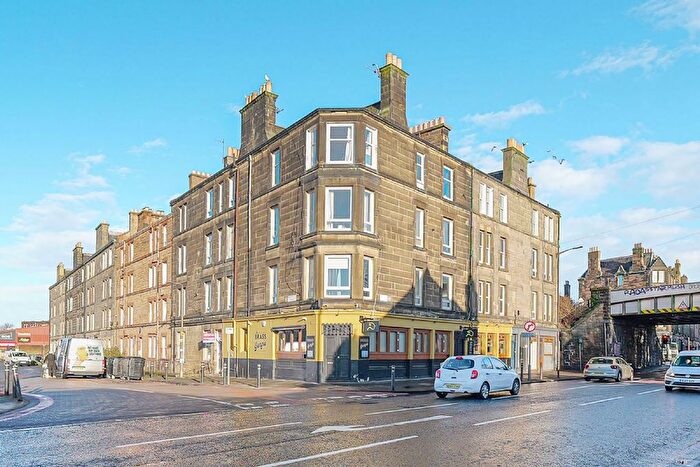
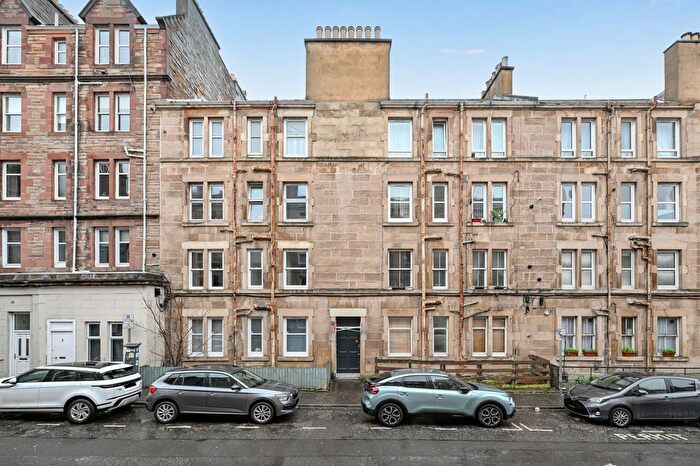
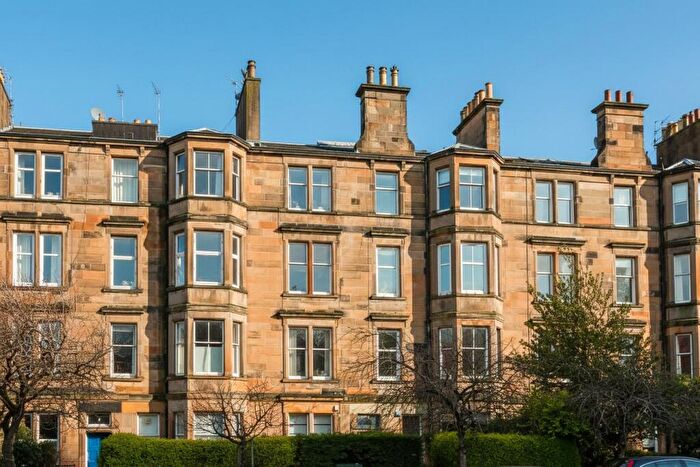
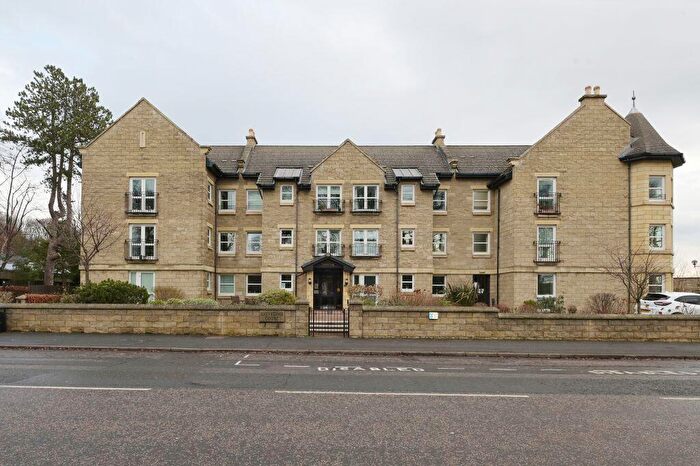
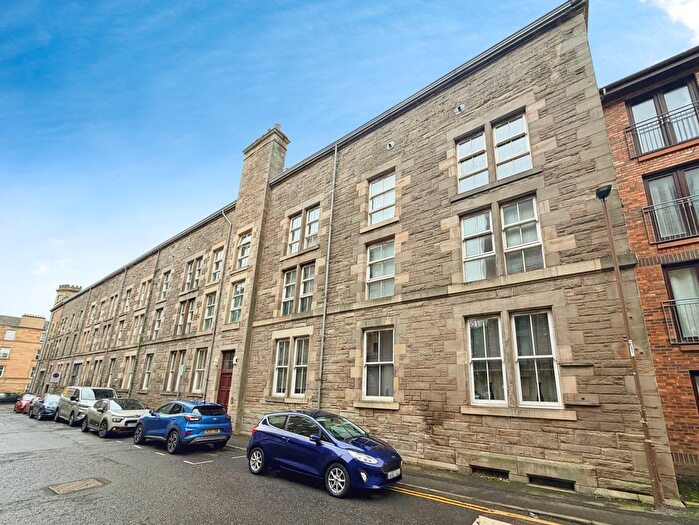
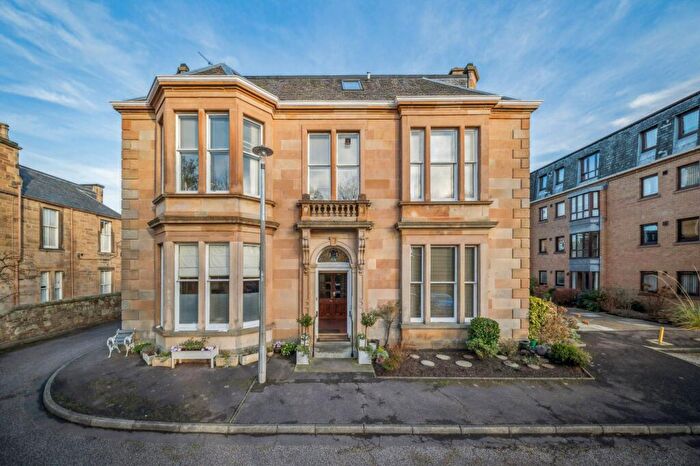
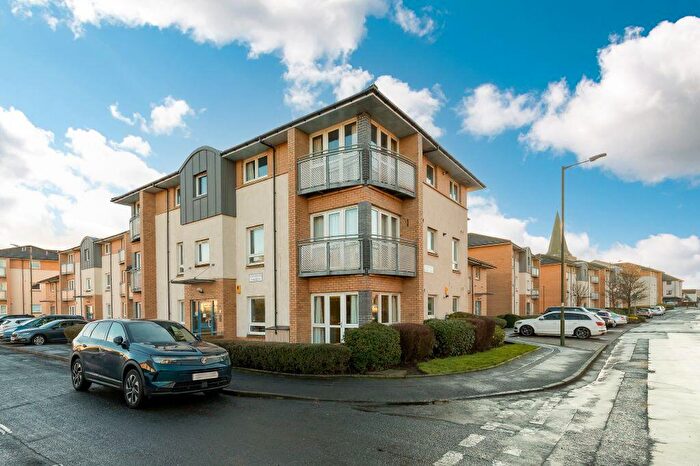
Houses for sale & to rent in Fountainbridge/Craiglockhart, Edinburgh
House Prices in Fountainbridge/Craiglockhart
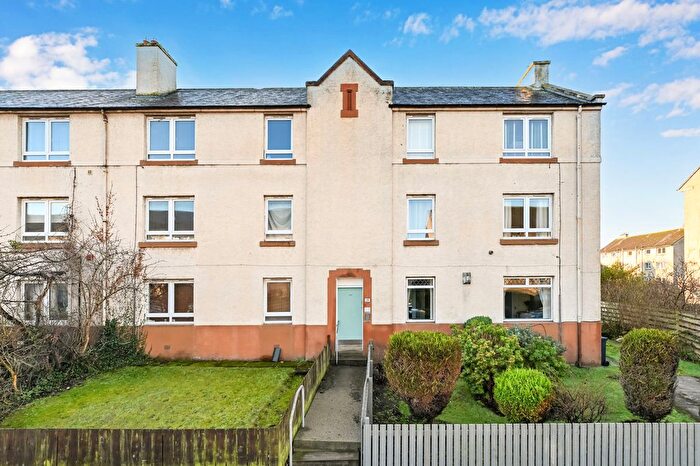
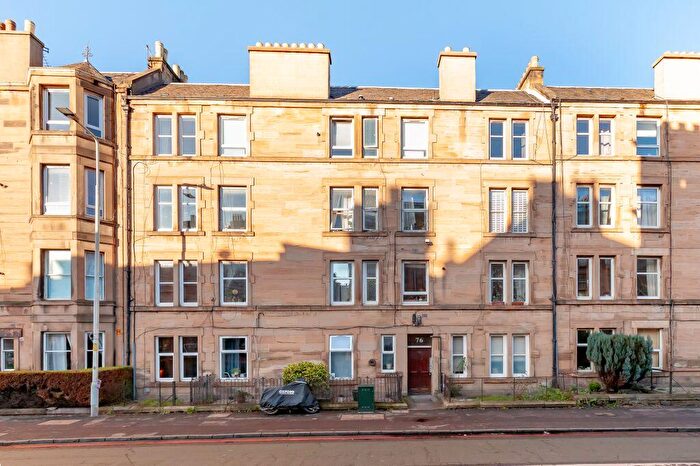
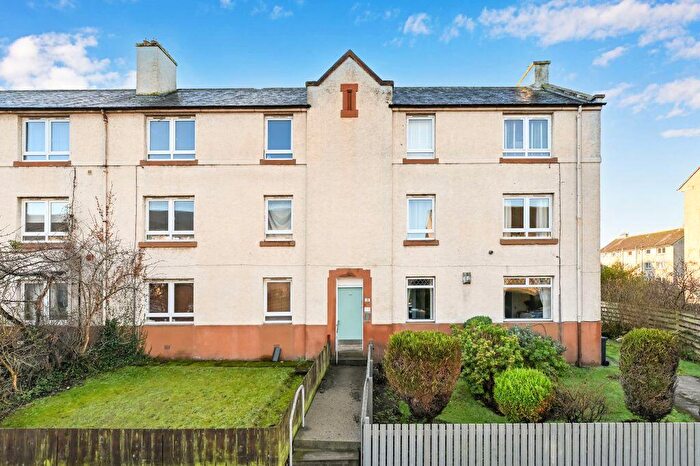
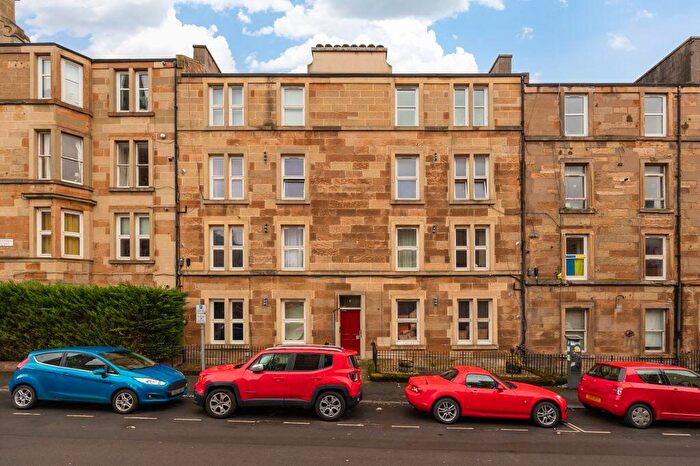
Properties in Fountainbridge/Craiglockhart have an average house price of £342,790.00 and had 71 Property Transactions within the last 3 years¹.
Fountainbridge/Craiglockhart is an area in Edinburgh, City of Edinburgh with 10,712 households², where the most expensive property was sold for £1,601,000.00.
Properties for sale in Fountainbridge/Craiglockhart
Roads and Postcodes in Fountainbridge/Craiglockhart
Navigate through our locations to find the location of your next house in Fountainbridge/Craiglockhart, Edinburgh for sale or to rent.
Transport near Fountainbridge/Craiglockhart
-
Slateford Station
-
Kingsknowe Station
-
Haymarket Station
-
Wester Hailes Station
-
Edinburgh Station
-
South Gyle Station
-
Edinburgh Park Station
- FAQ
- Price Paid By Year
Frequently asked questions about Fountainbridge/Craiglockhart
What is the average price for a property for sale in Fountainbridge/Craiglockhart?
The average price for a property for sale in Fountainbridge/Craiglockhart is £342,790. This amount is 8% higher than the average price in Edinburgh. There are 4,648 property listings for sale in Fountainbridge/Craiglockhart.
Which train stations are available in or near Fountainbridge/Craiglockhart?
Some of the train stations available in or near Fountainbridge/Craiglockhart are Slateford, Kingsknowe and Haymarket.
Property Price Paid in Fountainbridge/Craiglockhart by Year
The average sold property price by year was:
| Year | Average Sold Price | Price Change |
Sold Properties
|
|---|---|---|---|
| 2023 | £342,790 | 1% |
71 Properties |
| 2022 | £339,769 | 12% |
483 Properties |
| 2021 | £299,339 | 8% |
674 Properties |
| 2020 | £276,808 | 3% |
406 Properties |
| 2019 | £269,522 | -8% |
477 Properties |
| 2018 | £290,738 | 7% |
504 Properties |
| 2017 | £270,715 | 12% |
582 Properties |
| 2016 | £237,578 | 4% |
580 Properties |
| 2015 | £227,063 | 2% |
558 Properties |
| 2014 | £223,360 | 6% |
589 Properties |
| 2013 | £210,451 | -3% |
548 Properties |
| 2012 | £215,976 | 1% |
431 Properties |
| 2011 | £214,496 | -28% |
351 Properties |
| 2010 | £274,273 | 30% |
384 Properties |
| 2009 | £192,606 | -44% |
382 Properties |
| 2008 | £276,817 | 18% |
491 Properties |
| 2007 | £226,067 | 9% |
759 Properties |
| 2006 | £205,259 | -0,4% |
796 Properties |
| 2005 | £206,180 | 15% |
689 Properties |
| 2004 | £175,153 | 4% |
817 Properties |
| 2003 | £167,453 | 19% |
864 Properties |
| 2002 | £135,450 | 18% |
814 Properties |
| 2001 | £111,696 | 31% |
89 Properties |
| 2000 | £76,969 | - |
40 Properties |

