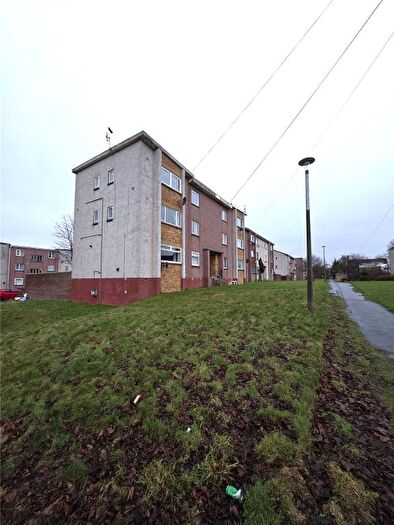
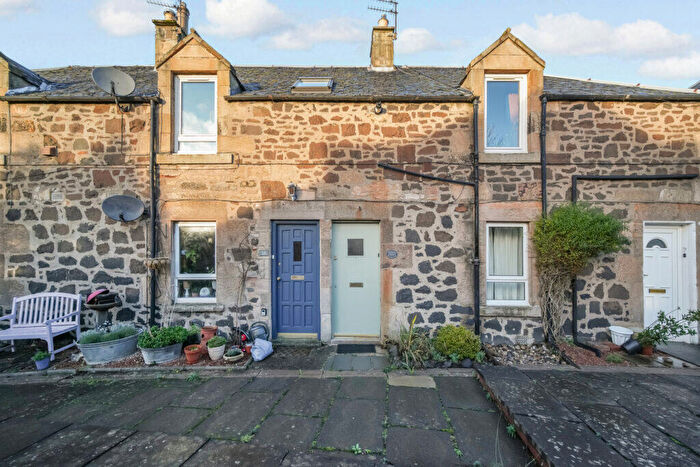
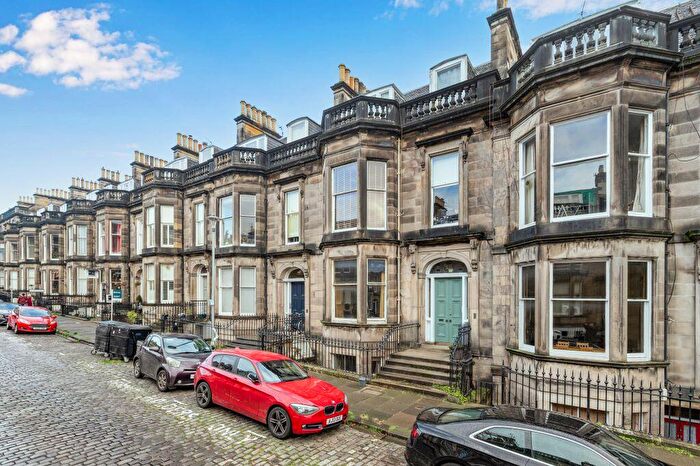
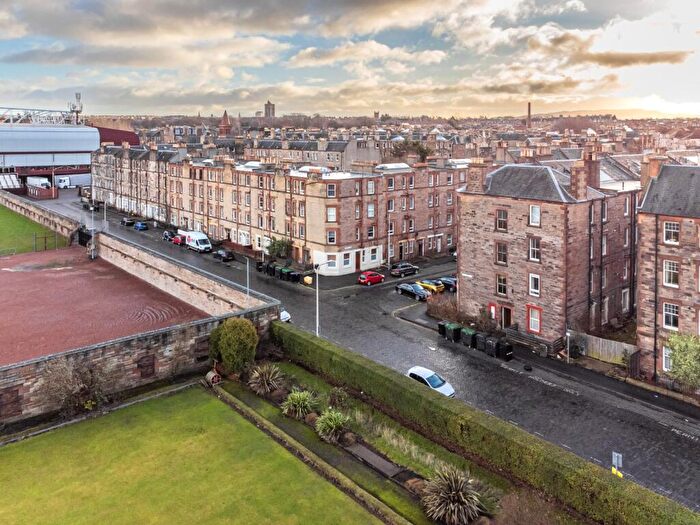
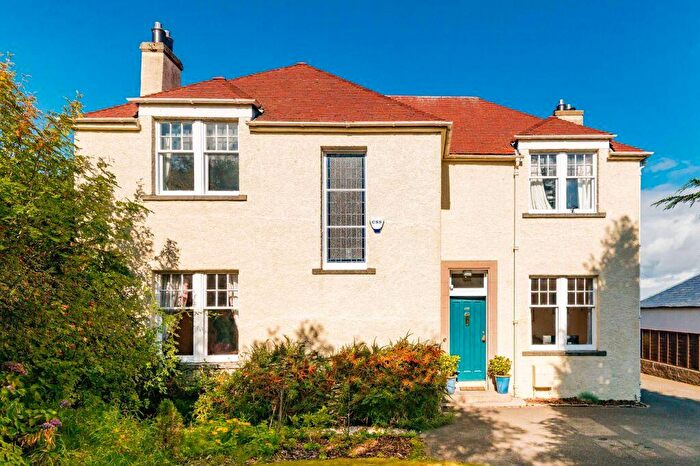
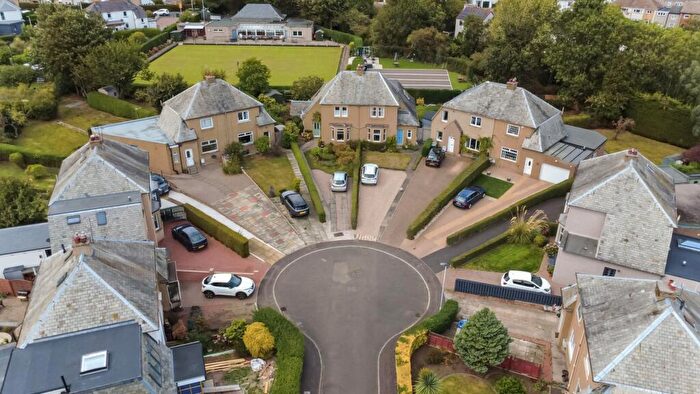
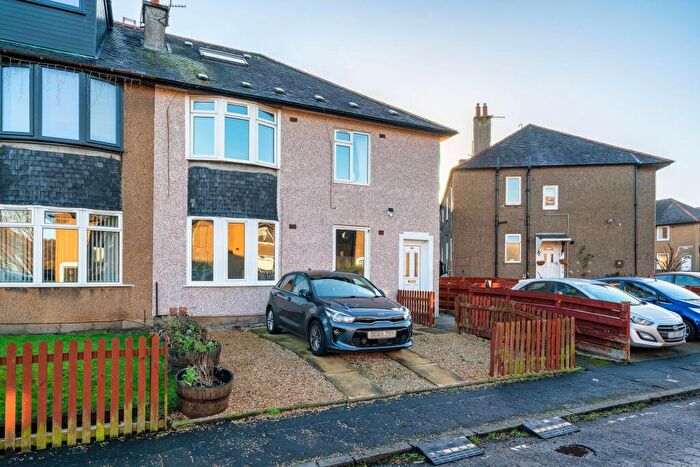
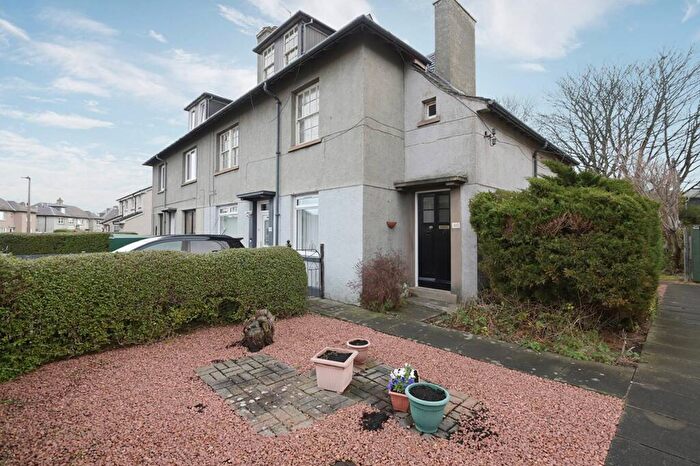
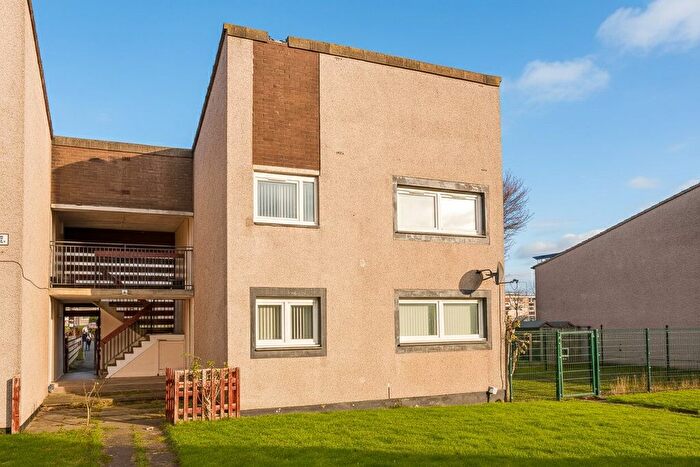
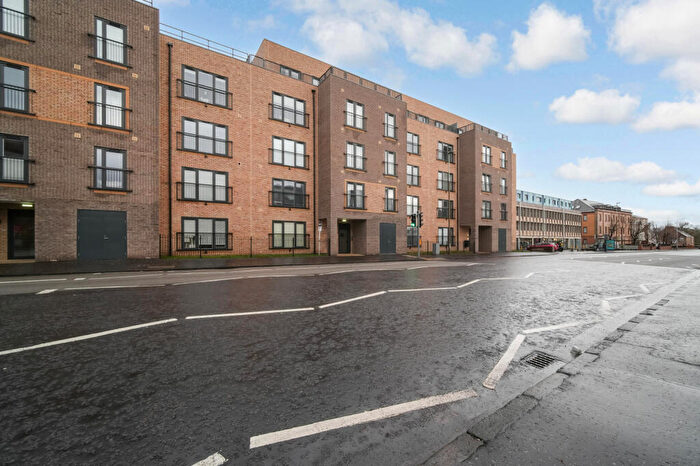
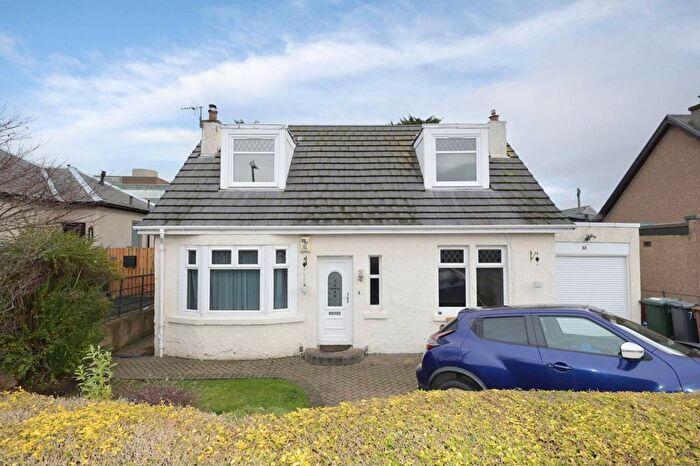
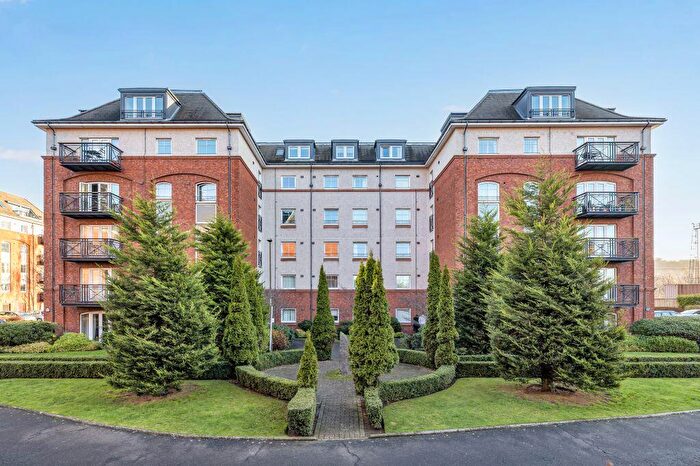
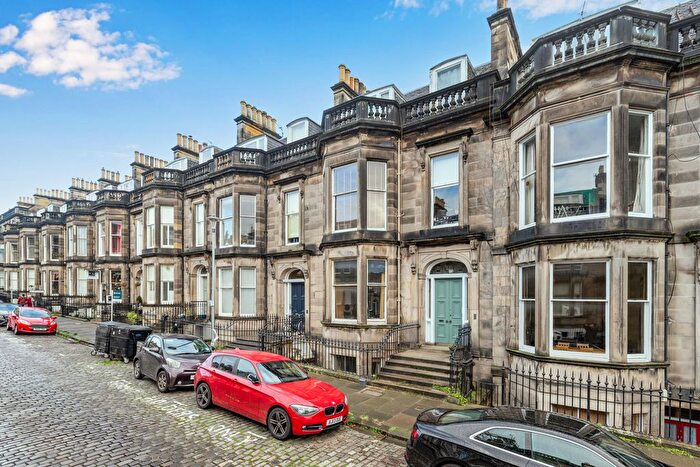
Houses for sale & to rent in Sighthill/Gorgie, Edinburgh
House Prices in Sighthill/Gorgie
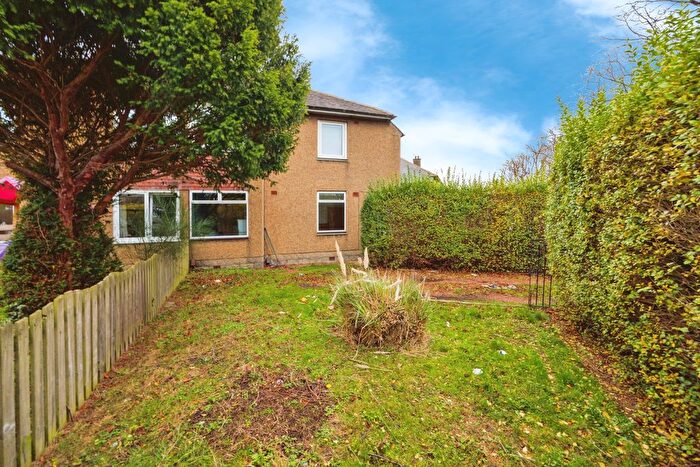
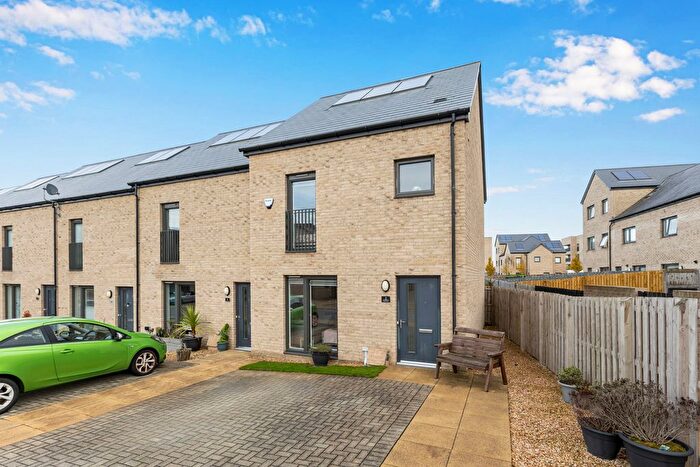
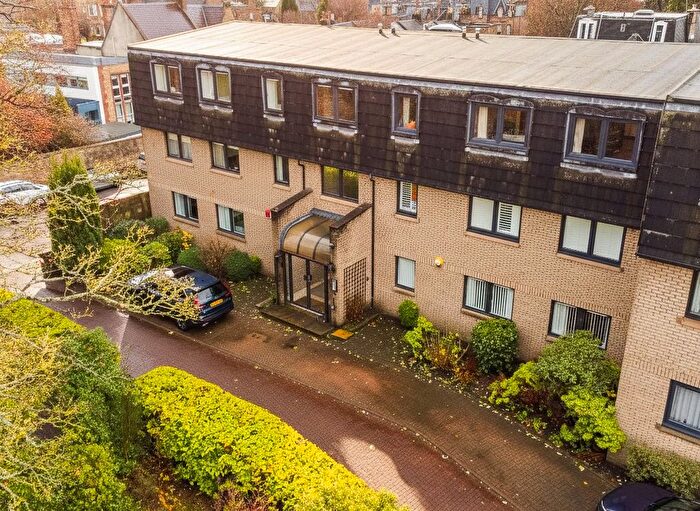
Properties in Sighthill/Gorgie have an average house price of £194,885.00 and had 769 Property Transactions within the last 3 years¹.
Sighthill/Gorgie is an area in Edinburgh, City of Edinburgh with 14,980 households², where the most expensive property was sold for £706,000.00.
Properties for sale in Sighthill/Gorgie
Roads and Postcodes in Sighthill/Gorgie
Navigate through our locations to find the location of your next house in Sighthill/Gorgie, Edinburgh for sale or to rent.
Transport near Sighthill/Gorgie
-
Slateford Station
-
Kingsknowe Station
-
Wester Hailes Station
-
South Gyle Station
-
Haymarket Station
-
Edinburgh Park Station
-
Edinburgh Gateway Station
- FAQ
- Price Paid By Year
Frequently asked questions about Sighthill/Gorgie
What is the average price for a property for sale in Sighthill/Gorgie?
The average price for a property for sale in Sighthill/Gorgie is £194,885. This amount is 42% lower than the average price in Edinburgh. There are 6,442 property listings for sale in Sighthill/Gorgie.
Which train stations are available in or near Sighthill/Gorgie?
Some of the train stations available in or near Sighthill/Gorgie are Slateford, Kingsknowe and Wester Hailes.
Property Price Paid in Sighthill/Gorgie by Year
The average sold property price by year was:
| Year | Average Sold Price | Price Change |
Sold Properties
|
|---|---|---|---|
| 2023 | £193,216 | -1% |
121 Properties |
| 2022 | £195,197 | 7% |
648 Properties |
| 2021 | £182,361 | 3% |
798 Properties |
| 2020 | £177,156 | 1% |
533 Properties |
| 2019 | £176,014 | 5% |
793 Properties |
| 2018 | £166,699 | 10% |
724 Properties |
| 2017 | £149,428 | 7% |
715 Properties |
| 2016 | £138,264 | 2% |
724 Properties |
| 2015 | £135,915 | 5% |
787 Properties |
| 2014 | £129,024 | 7% |
685 Properties |
| 2013 | £120,363 | 4% |
513 Properties |
| 2012 | £115,501 | -11% |
383 Properties |
| 2011 | £127,850 | 5% |
382 Properties |
| 2010 | £121,285 | -3% |
423 Properties |
| 2009 | £125,164 | -13% |
436 Properties |
| 2008 | £141,637 | 1% |
673 Properties |
| 2007 | £139,608 | 11% |
943 Properties |
| 2006 | £124,676 | 6% |
1,084 Properties |
| 2005 | £116,988 | 9% |
1,079 Properties |
| 2004 | £106,464 | 14% |
1,148 Properties |
| 2003 | £91,802 | 18% |
1,163 Properties |
| 2002 | £75,185 | 18% |
1,113 Properties |
| 2001 | £61,809 | 7% |
135 Properties |
| 2000 | £57,483 | - |
79 Properties |

