
Houses for sale & to rent in Forth, Edinburgh
House Prices in Forth
Properties in Forth have an average house price of £351k and had 450 Property Transactions within the last 3 years¹.
Forth is an area in Edinburgh, City of Edinburgh with 13,716 households², where the most expensive property was sold for £2.19M.
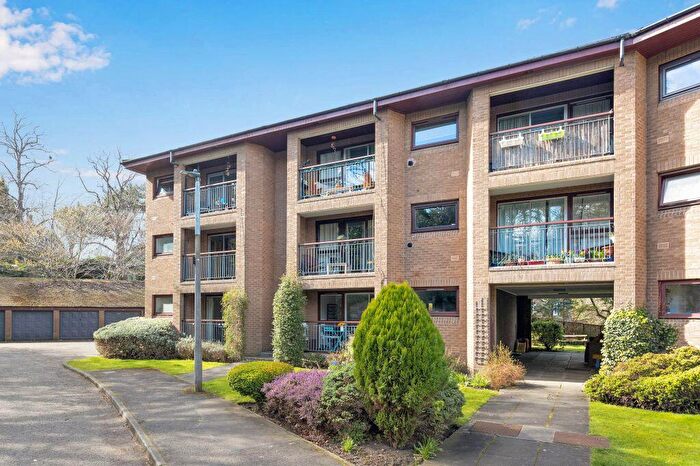
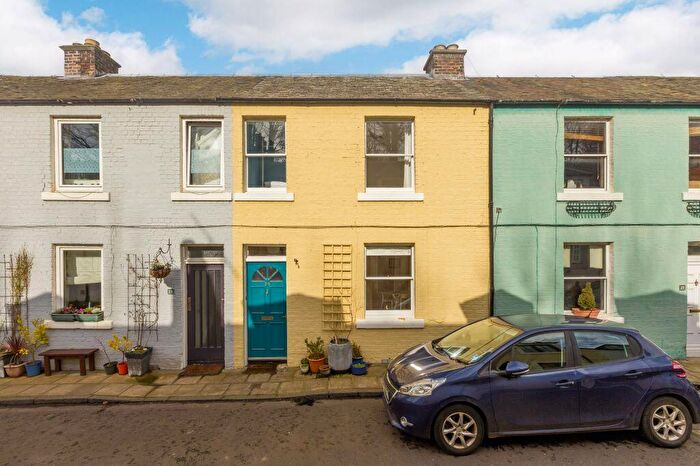
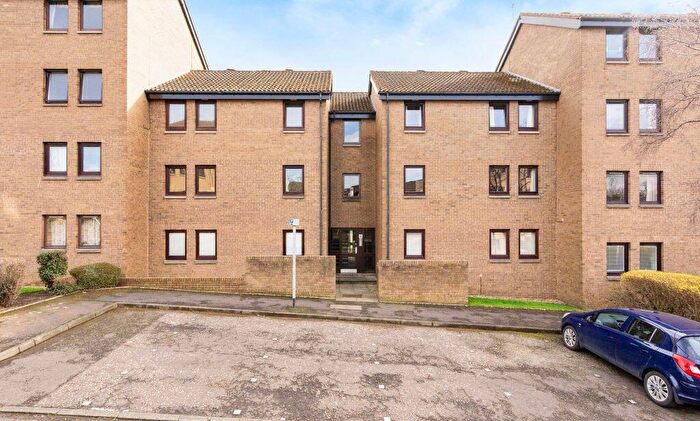
Properties for sale in Forth
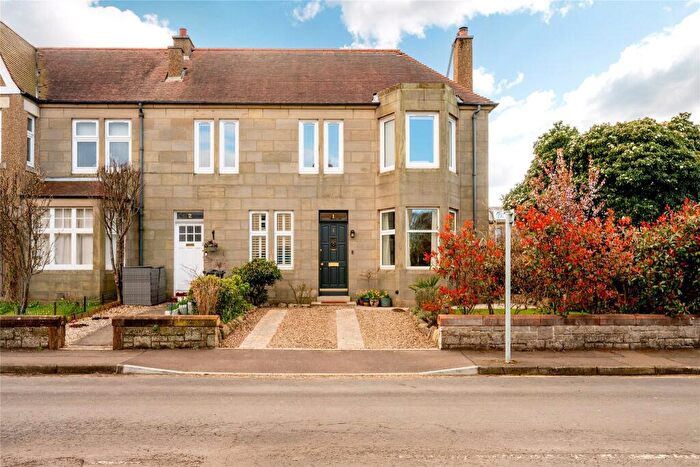

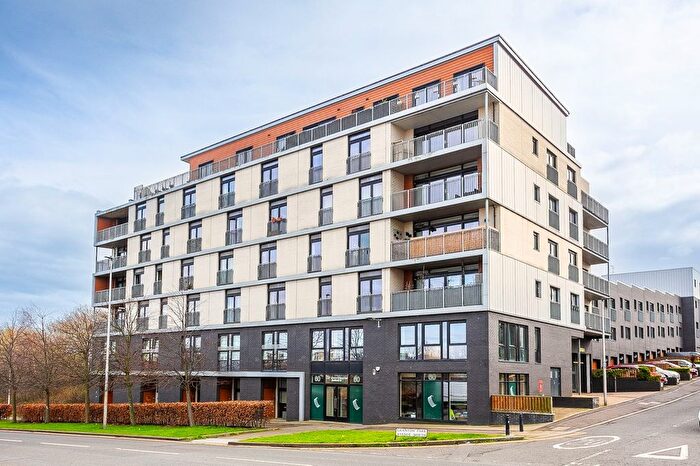
![]()
If you are looking to sell your house, let it out, or receive a property valuation, an expert can help you.
Click the button below to get started.


Roads and Postcodes in Forth
Navigate through our locations to find the location of your next house in Forth, Edinburgh for sale or to rent.
Transport near Forth
-
 Edinburgh Station
 -
Haymarket Station
-
Slateford Station
-
South Gyle Station
-
Kingsknowe Station
-
Edinburgh Gateway Station
-
Edinburgh Park Station
-
Wester Hailes Station
- FAQ
- Price Paid By Year
Frequently asked questions about Forth
What is the average price for a property for sale in Forth?
The average price for a property for sale in Forth is £351,446. This amount is 9% lower than the average price in Edinburgh. There are 3,511 property listings for sale in Forth.
What streets have the most expensive properties for sale in Forth?
The streets with the most expensive properties for sale in Forth are Lennox Row at an average of £1,402,108, Wardie Road at an average of £1,300,000 and Derby Street at an average of £1,300,000.
What streets have the most affordable properties for sale in Forth?
The streets with the most affordable properties for sale in Forth are West Granton Road at an average of £68,331, Northview Court at an average of £79,023 and West Pilton Terrace at an average of £117,500.
Which train stations are available in or near Forth?
Some of the train stations available in or near Forth are Edinburgh, Haymarket and Slateford.
Property Price Paid in Forth by Year
The average sold property price by year was:
| Year | Average Sold Price | Price Change |
Sold Properties
|
|---|---|---|---|
| 2025 | £349,867 | -14% |
129 Properties |
| 2024 | £399,223 | 18% |
115 Properties |
| 2023 | £325,764 | 3% |
206 Properties |
| 2022 | £317,009 | 14% |
628 Properties |
| 2021 | £271,975 | 6% |
793 Properties |
| 2020 | £255,540 | 13% |
558 Properties |
| 2019 | £223,369 | -2% |
713 Properties |
| 2018 | £227,296 | 12% |
690 Properties |
| 2017 | £200,379 | 2% |
748 Properties |
| 2016 | £196,487 | -16% |
816 Properties |
| 2015 | £227,790 | 11% |
675 Properties |
| 2014 | £203,726 | -1% |
708 Properties |
| 2013 | £206,244 | 6% |
678 Properties |
| 2012 | £193,764 | 3% |
458 Properties |
| 2011 | £188,204 | -1% |
382 Properties |
| 2010 | £190,952 | -68% |
422 Properties |
| 2009 | £321,612 | 45% |
489 Properties |
| 2008 | £177,754 | -6% |
741 Properties |
| 2007 | £188,242 | 15% |
789 Properties |
| 2006 | £160,489 | -23% |
846 Properties |
| 2005 | £197,046 | 32% |
688 Properties |
| 2004 | £134,804 | 10% |
793 Properties |
| 2003 | £121,165 | -13% |
737 Properties |
| 2002 | £136,394 | 32% |
798 Properties |
| 2001 | £92,111 | -9% |
86 Properties |
| 2000 | £100,351 | - |
46 Properties |