
Houses for sale & to rent in Leith Walk, Edinburgh
House Prices in Leith Walk
Properties in Leith Walk have an average house price of £327k and had 439 Property Transactions within the last 3 years¹.
Leith Walk is an area in Edinburgh, City of Edinburgh with 17,357 households², where the most expensive property was sold for £1.75M.
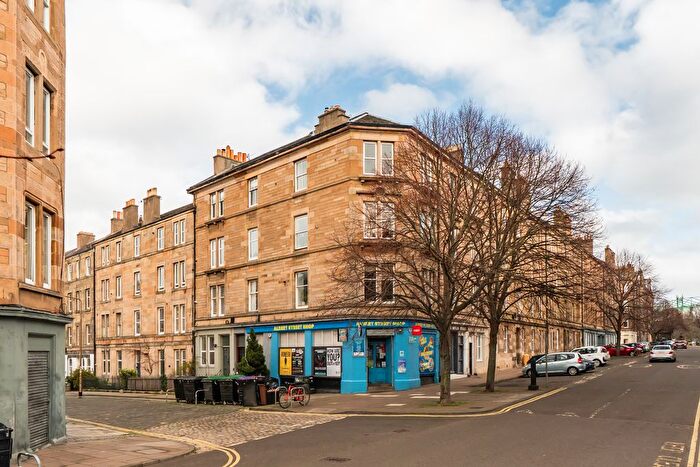
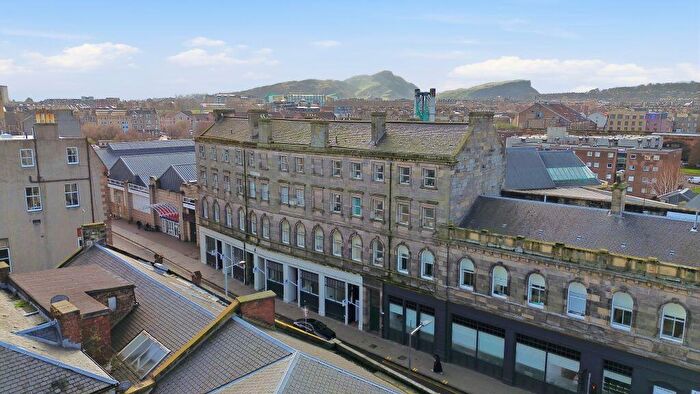
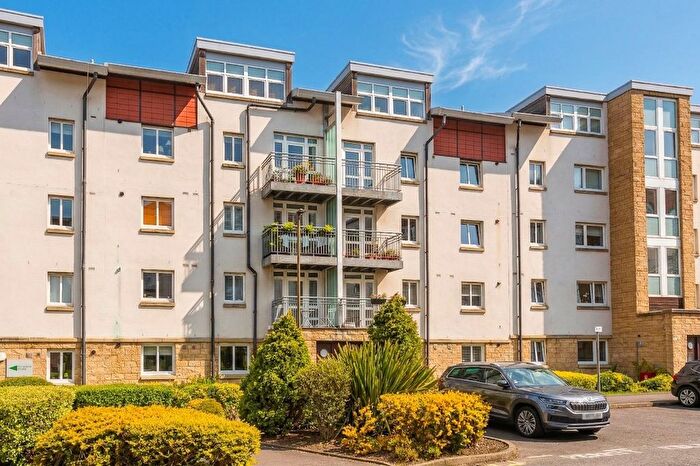
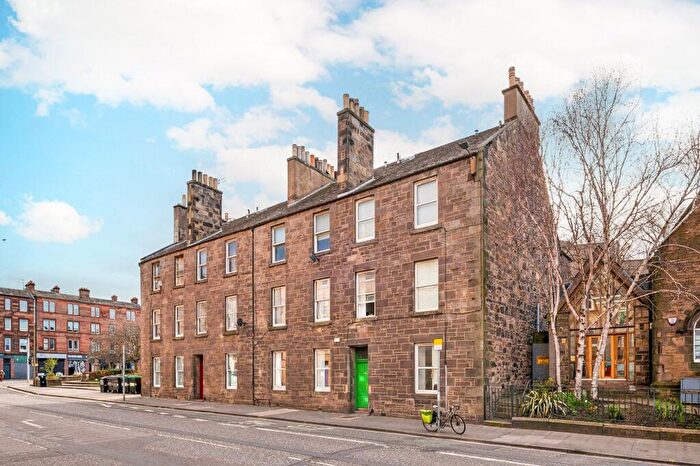
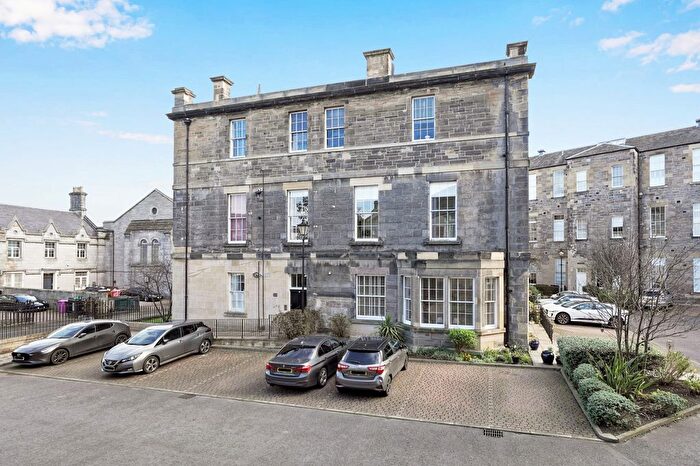
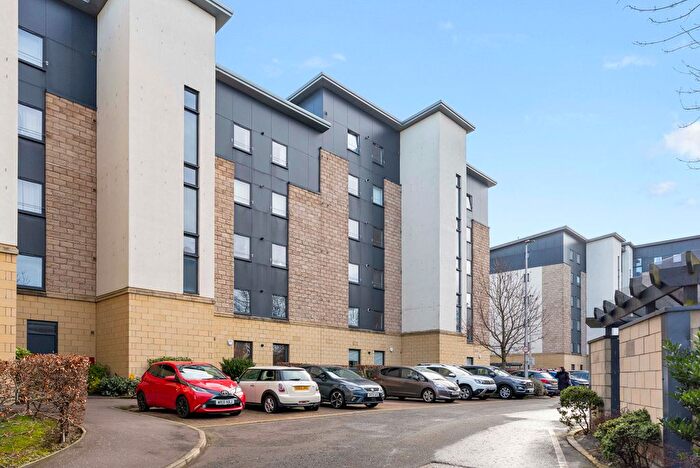
Properties for sale in Leith Walk
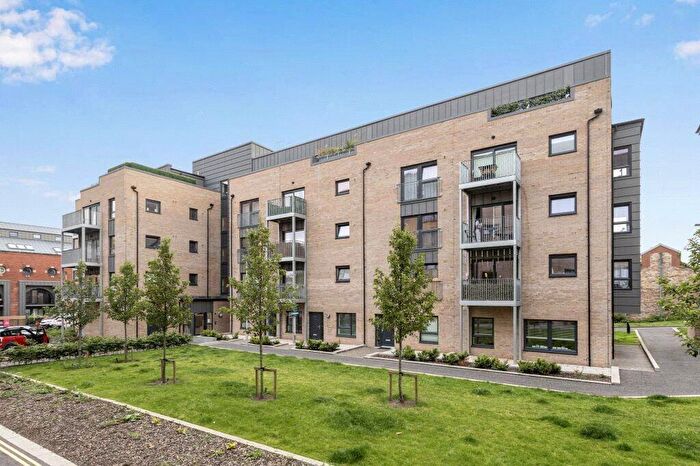
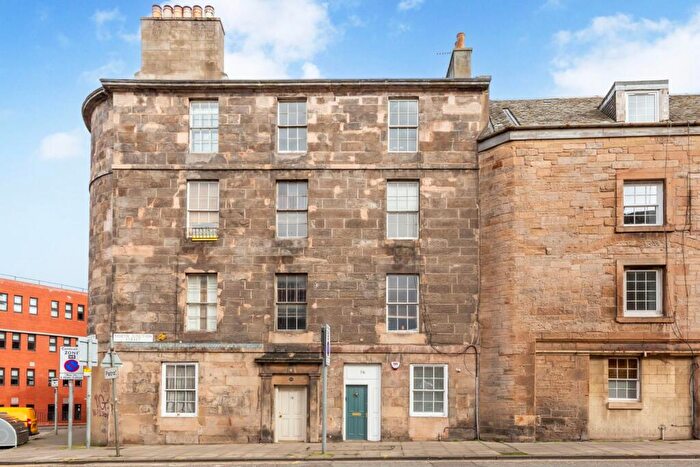

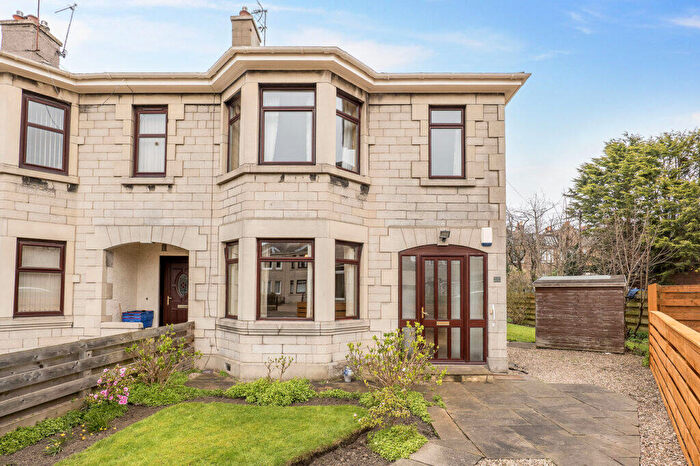
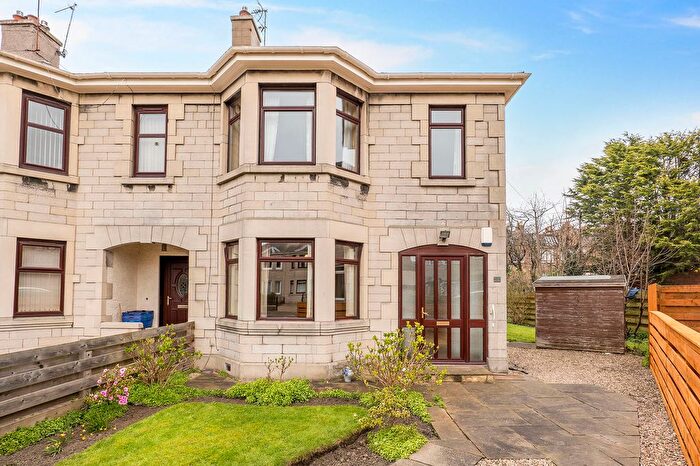
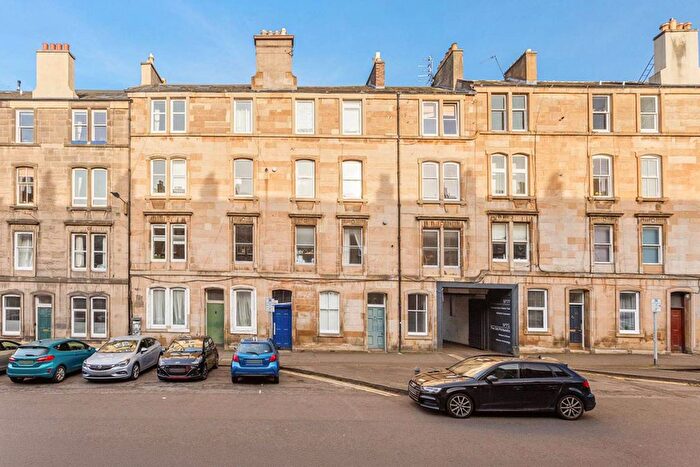
![]()
If you are looking to sell your house, let it out, or receive a property valuation, an expert can help you.
Click the button below to get started.


Roads and Postcodes in Leith Walk
Navigate through our locations to find the location of your next house in Leith Walk, Edinburgh for sale or to rent.
Transport near Leith Walk
-
 Edinburgh Station
 -
Haymarket Station
-
Brunstane Station
-
Slateford Station
-
Newcraighall Station
-
Kingsknowe Station
-
Musselburgh Station
- FAQ
- Price Paid By Year
Frequently asked questions about Leith Walk
What is the average price for a property for sale in Leith Walk?
The average price for a property for sale in Leith Walk is £326,720. This amount is 15% lower than the average price in Edinburgh. There are 3,586 property listings for sale in Leith Walk.
What streets have the most expensive properties for sale in Leith Walk?
The streets with the most expensive properties for sale in Leith Walk are Windsor Street at an average of £1,449,000, Claremont Crescent at an average of £1,041,500 and East Claremont Street at an average of £756,647.
What streets have the most affordable properties for sale in Leith Walk?
The streets with the most affordable properties for sale in Leith Walk are Brunton Place at an average of £70,000, Trafalgar Street at an average of £141,737 and Bothwell Street at an average of £176,375.
Which train stations are available in or near Leith Walk?
Some of the train stations available in or near Leith Walk are Edinburgh, Haymarket and Brunstane.
Property Price Paid in Leith Walk by Year
The average sold property price by year was:
| Year | Average Sold Price | Price Change |
Sold Properties
|
|---|---|---|---|
| 2025 | £360,428 | -8% |
100 Properties |
| 2024 | £387,828 | 25% |
93 Properties |
| 2023 | £289,916 | 11% |
246 Properties |
| 2022 | £258,057 | 4% |
974 Properties |
| 2021 | £248,776 | 3% |
1,098 Properties |
| 2020 | £241,114 | 6% |
751 Properties |
| 2019 | £226,724 | 3% |
978 Properties |
| 2018 | £220,903 | 1% |
999 Properties |
| 2017 | £219,377 | 16% |
1,123 Properties |
| 2016 | £183,924 | 4% |
1,154 Properties |
| 2015 | £176,019 | 3% |
1,084 Properties |
| 2014 | £171,021 | 7% |
1,045 Properties |
| 2013 | £159,714 | -1% |
796 Properties |
| 2012 | £160,975 | -1% |
598 Properties |
| 2011 | £162,940 | 1% |
543 Properties |
| 2010 | £160,534 | 2% |
596 Properties |
| 2009 | £156,665 | -14% |
709 Properties |
| 2008 | £179,069 | -2% |
817 Properties |
| 2007 | £182,026 | 12% |
1,157 Properties |
| 2006 | £159,890 | 14% |
1,370 Properties |
| 2005 | £137,546 | -3% |
1,174 Properties |
| 2004 | £141,284 | 13% |
1,772 Properties |
| 2003 | £122,516 | -1% |
1,672 Properties |
| 2002 | £123,789 | 37% |
1,565 Properties |
| 2001 | £78,079 | 6% |
180 Properties |
| 2000 | £73,517 | - |
69 Properties |