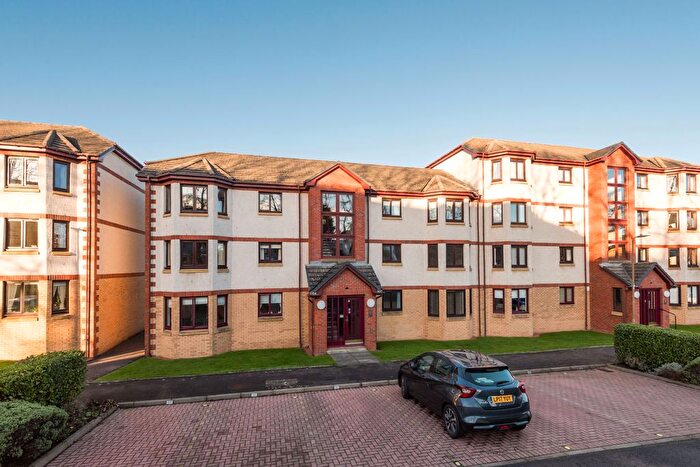
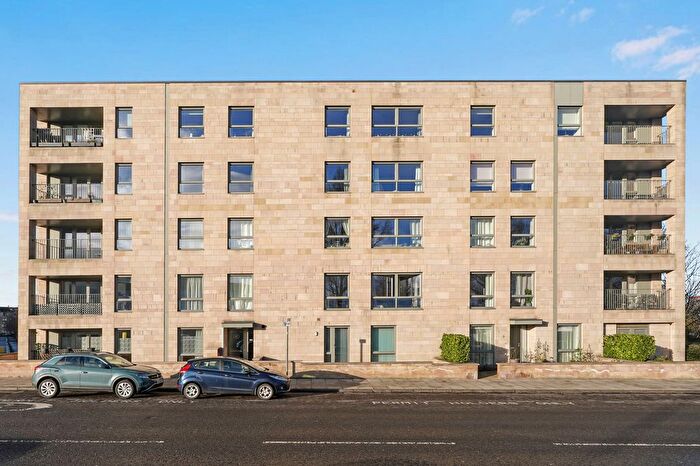
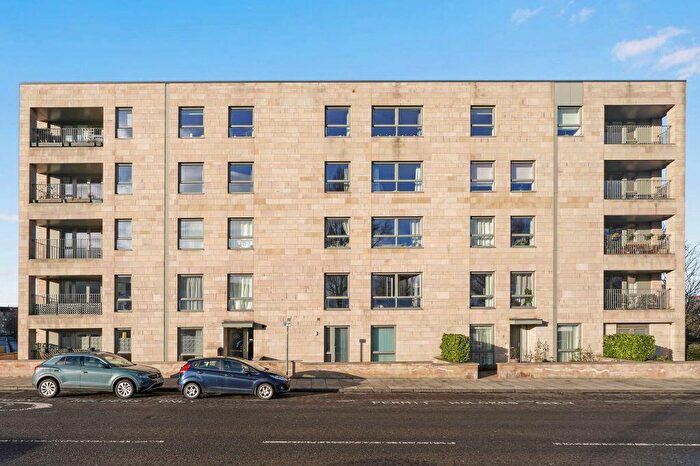
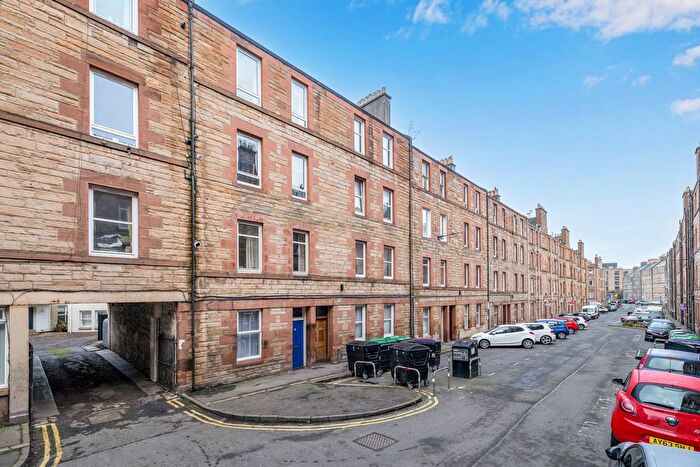
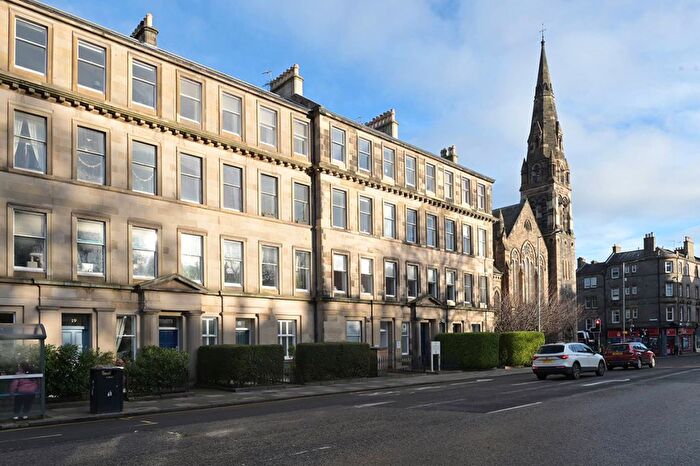
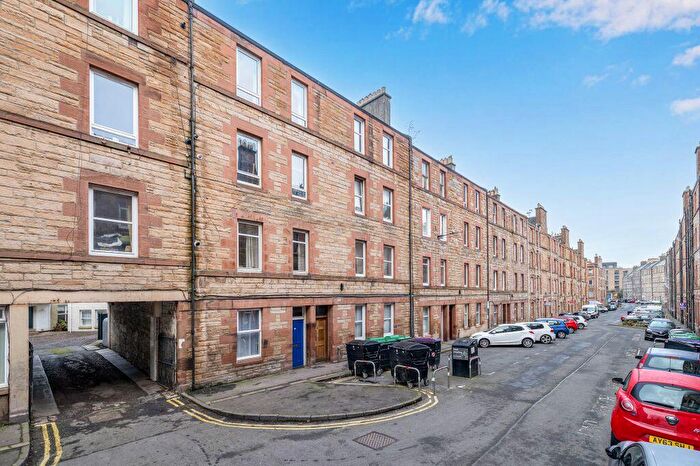
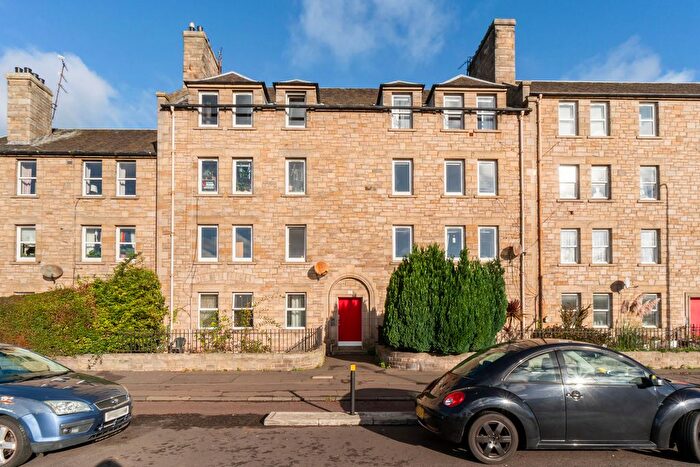
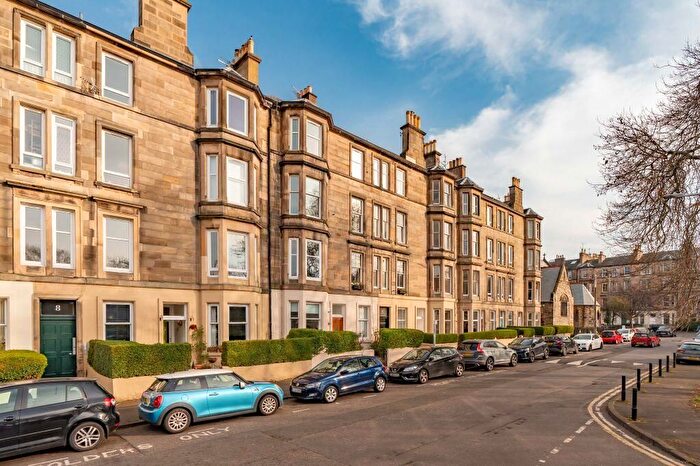
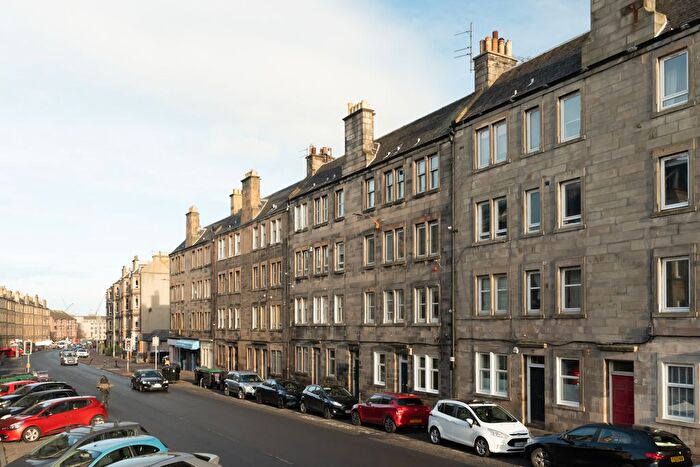
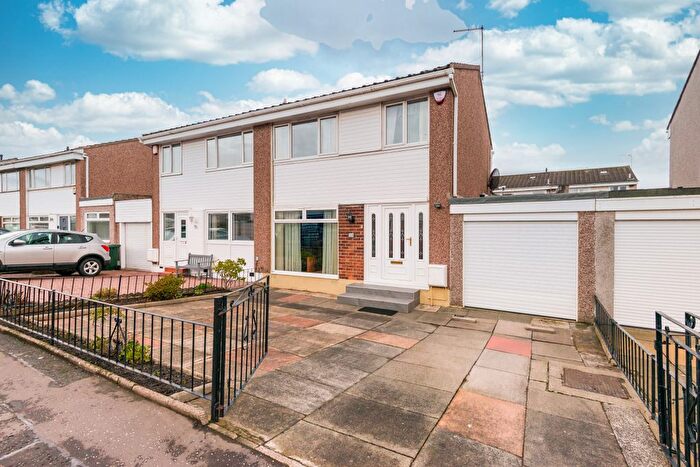
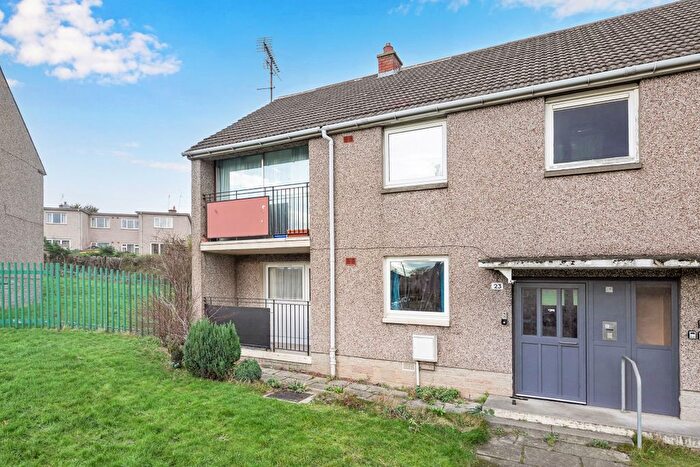
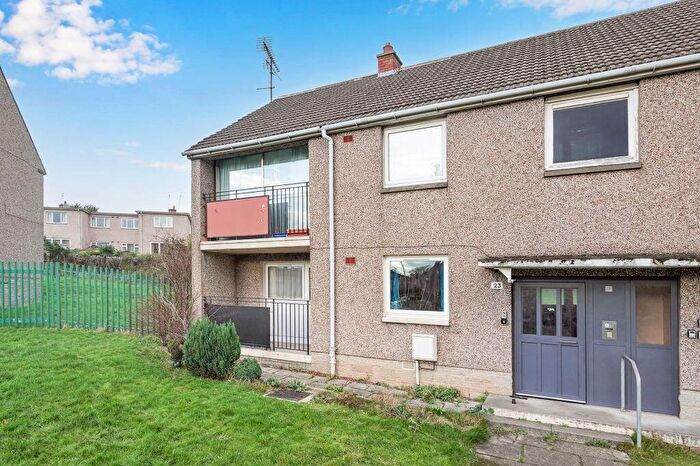
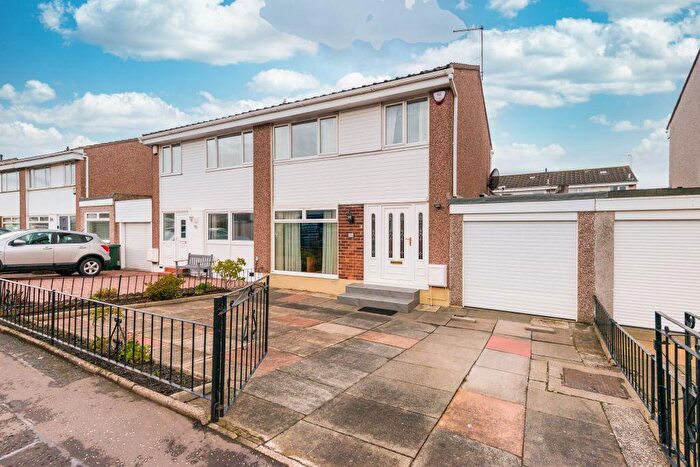
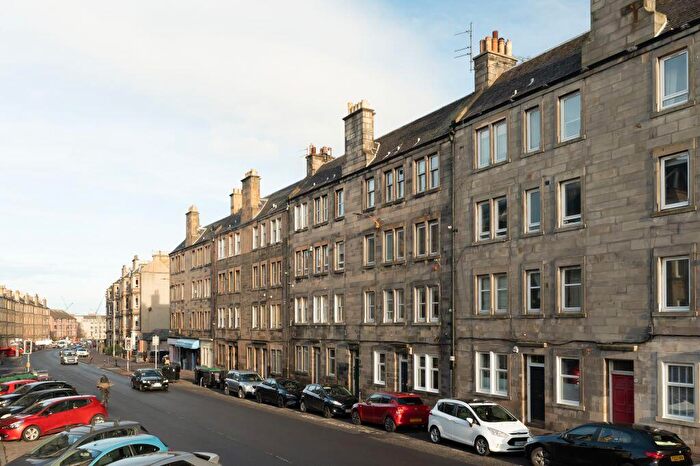
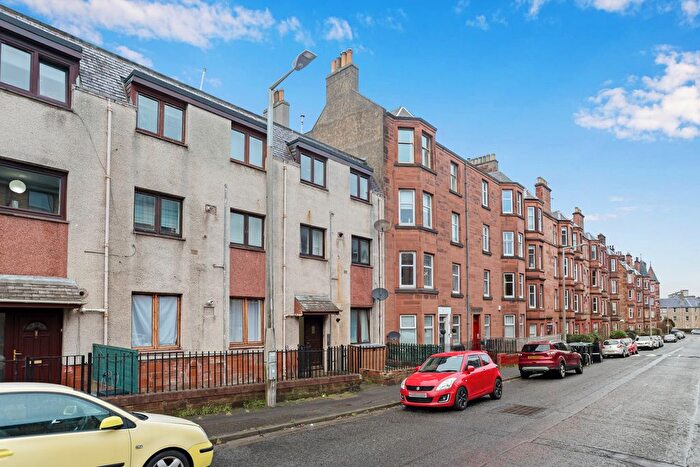
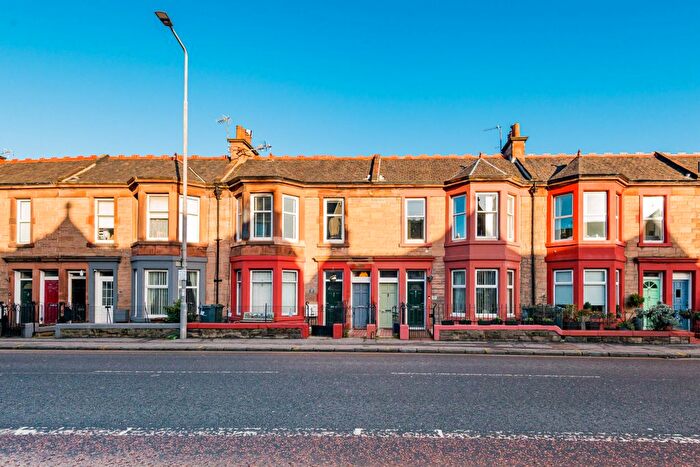
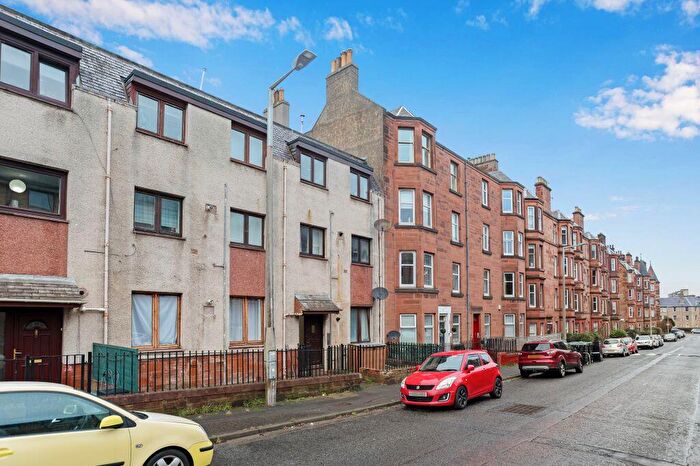
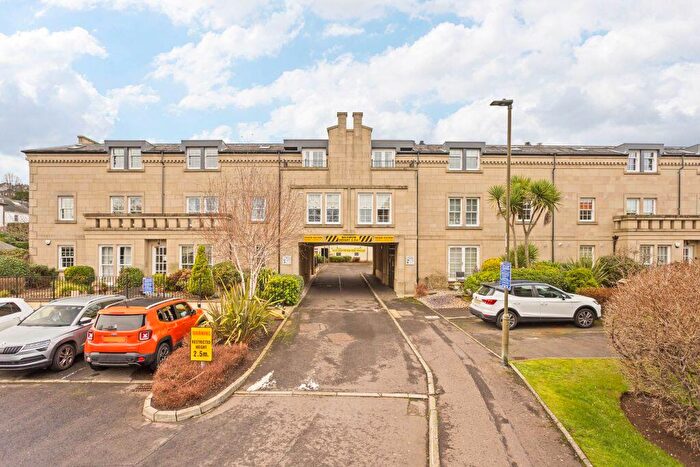
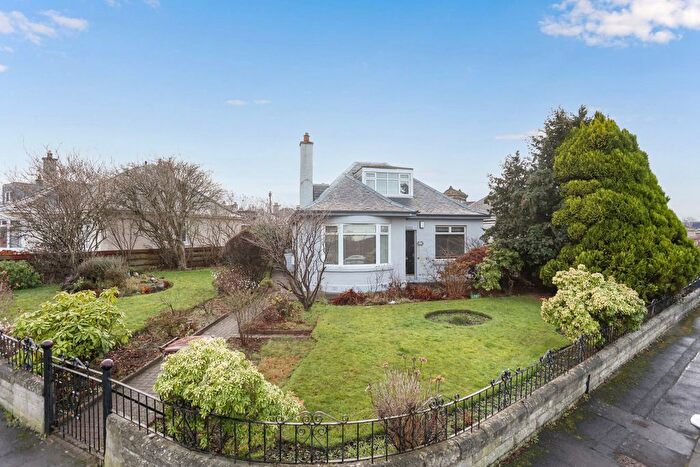
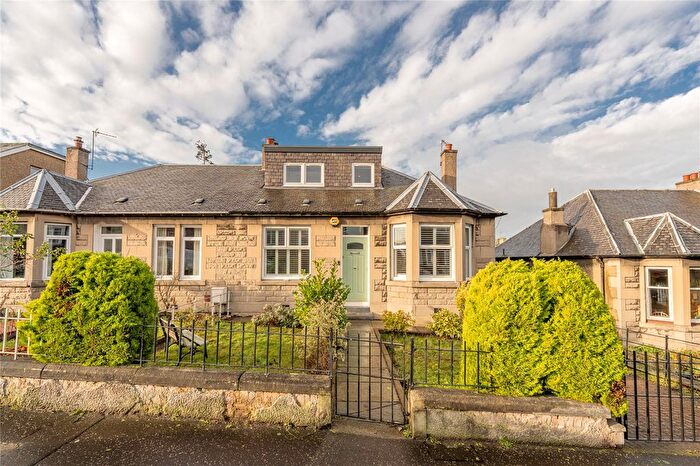
Houses for sale & to rent in Craigentinny/Duddingston, Edinburgh
House Prices in Craigentinny/Duddingston
Properties in Craigentinny/Duddingston have an average house price of £234,179.00 and had 135 Property Transactions within the last 3 years¹.
Craigentinny/Duddingston is an area in Edinburgh, City of Edinburgh with 14,643 households², where the most expensive property was sold for £565,650.00.
Properties for sale in Craigentinny/Duddingston
Roads and Postcodes in Craigentinny/Duddingston
Navigate through our locations to find the location of your next house in Craigentinny/Duddingston, Edinburgh for sale or to rent.
Transport near Craigentinny/Duddingston
- FAQ
- Price Paid By Year
Frequently asked questions about Craigentinny/Duddingston
What is the average price for a property for sale in Craigentinny/Duddingston?
The average price for a property for sale in Craigentinny/Duddingston is £234,179. This amount is 26% lower than the average price in Edinburgh. There are 3,760 property listings for sale in Craigentinny/Duddingston.
Which train stations are available in or near Craigentinny/Duddingston?
Some of the train stations available in or near Craigentinny/Duddingston are Edinburgh, Brunstane and Newcraighall.
Property Price Paid in Craigentinny/Duddingston by Year
The average sold property price by year was:
| Year | Average Sold Price | Price Change |
Sold Properties
|
|---|---|---|---|
| 2023 | £234,179 | -8% |
135 Properties |
| 2022 | £251,996 | 10% |
655 Properties |
| 2021 | £225,925 | 3% |
821 Properties |
| 2020 | £219,538 | 4% |
545 Properties |
| 2019 | £211,116 | 4% |
738 Properties |
| 2018 | £202,487 | 7% |
714 Properties |
| 2017 | £187,961 | 5% |
754 Properties |
| 2016 | £178,153 | 7% |
747 Properties |
| 2015 | £164,891 | 9% |
638 Properties |
| 2014 | £149,542 | -2% |
595 Properties |
| 2013 | £152,413 | 3% |
501 Properties |
| 2012 | £148,515 | -2% |
458 Properties |
| 2011 | £150,745 | -16% |
358 Properties |
| 2010 | £174,434 | 11% |
354 Properties |
| 2009 | £155,330 | -7% |
410 Properties |
| 2008 | £165,602 | -1661,8% |
547 Properties |
| 2007 | £2,917,630 | 95% |
762 Properties |
| 2006 | £145,269 | -33% |
877 Properties |
| 2005 | £193,005 | 34% |
820 Properties |
| 2004 | £126,440 | 14% |
915 Properties |
| 2003 | £108,358 | 4% |
1,043 Properties |
| 2002 | £103,637 | 33% |
953 Properties |
| 2001 | £68,929 | -23% |
126 Properties |
| 2000 | £84,912 | - |
47 Properties |

