
Houses for sale & to rent in EH15 1DE, Portobello High Street, Portobello/Craigmillar, Edinburgh
House Prices in EH15 1DE, Portobello High Street, Portobello/Craigmillar
Properties in EH15 1DE have an average house price of £150,000.00 and had 1 Property Transaction within the last 3 years.¹ EH15 1DE is a postcode in Portobello High Street located in Portobello/Craigmillar, an area in Edinburgh, City of Edinburgh, with 13 households², where the most expensive property was sold for £150,000.00.
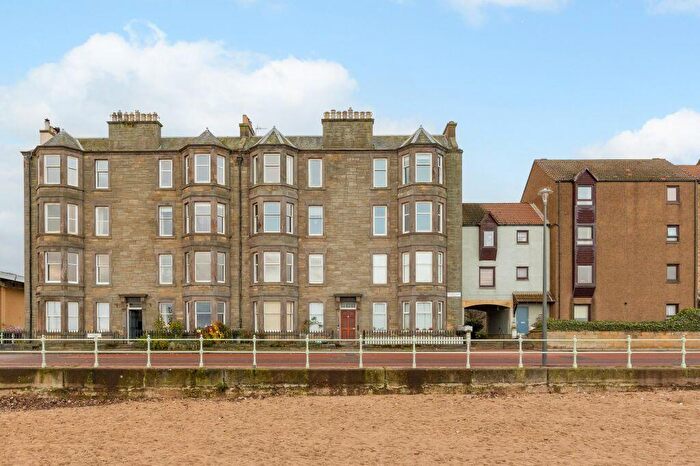
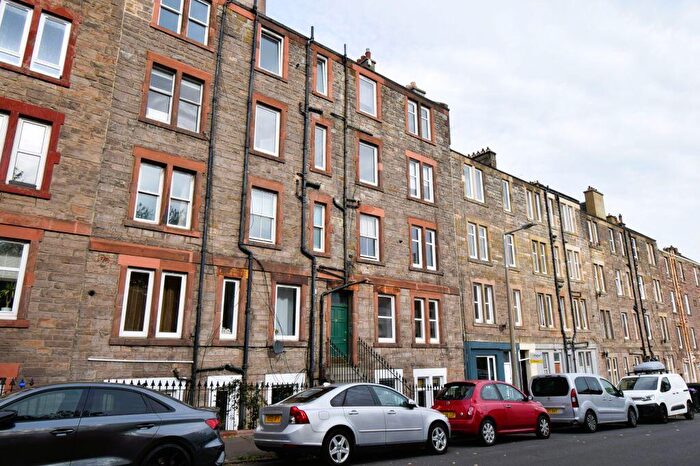
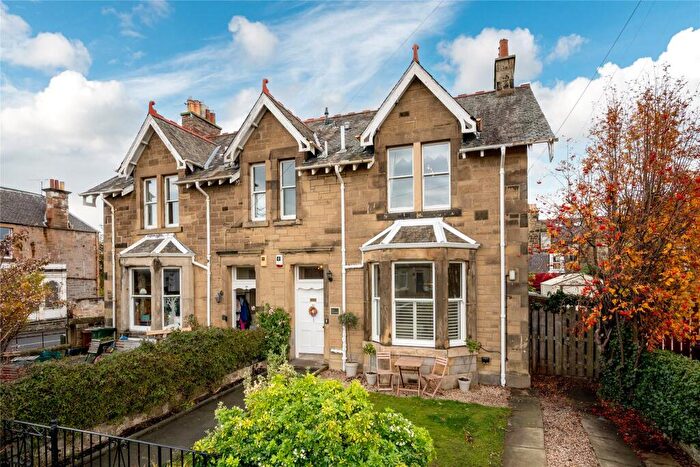
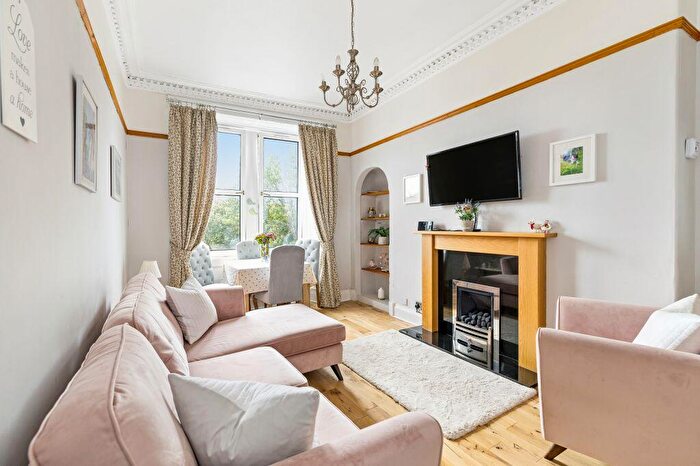
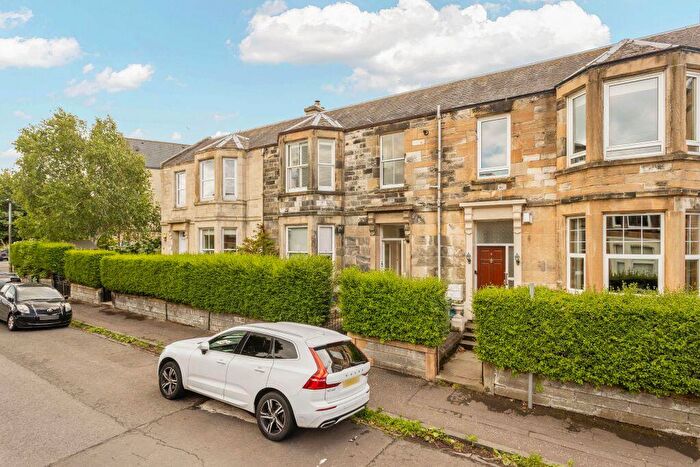
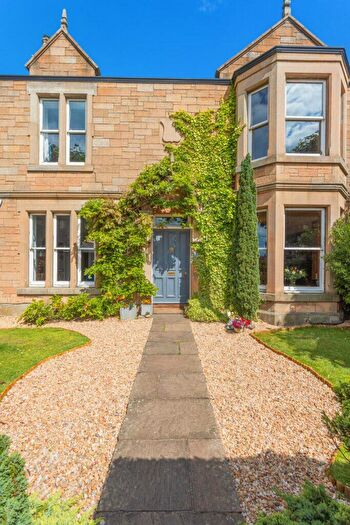
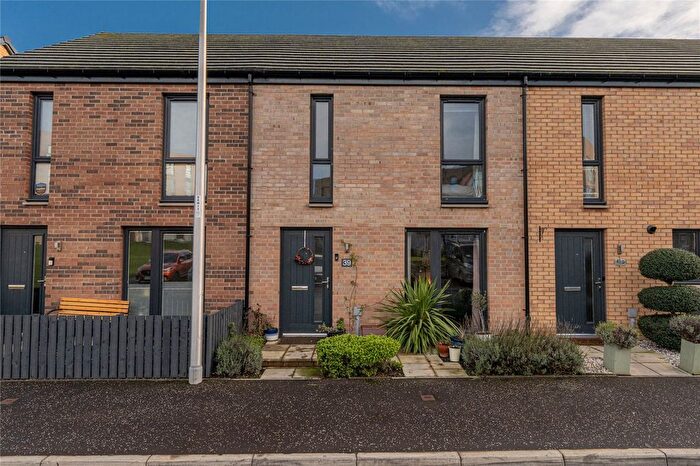
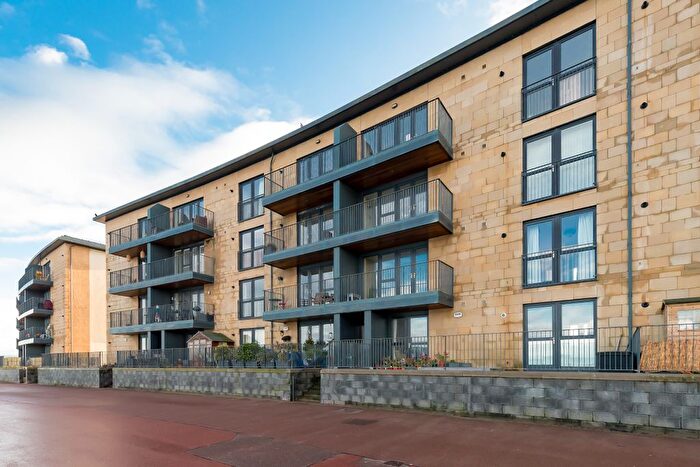
Properties for sale near EH15 1DE, Portobello High Street
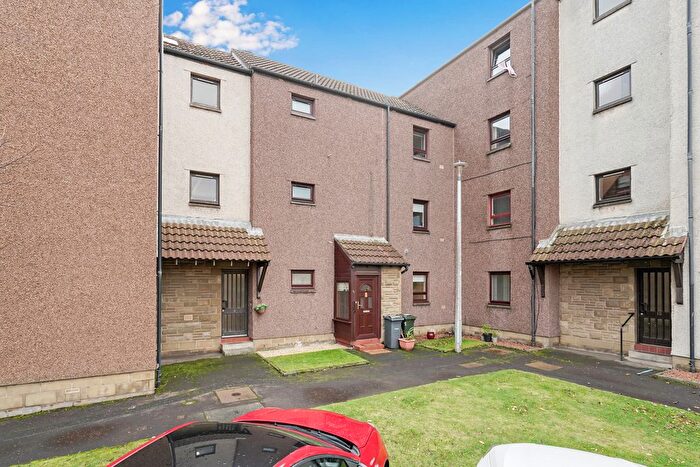
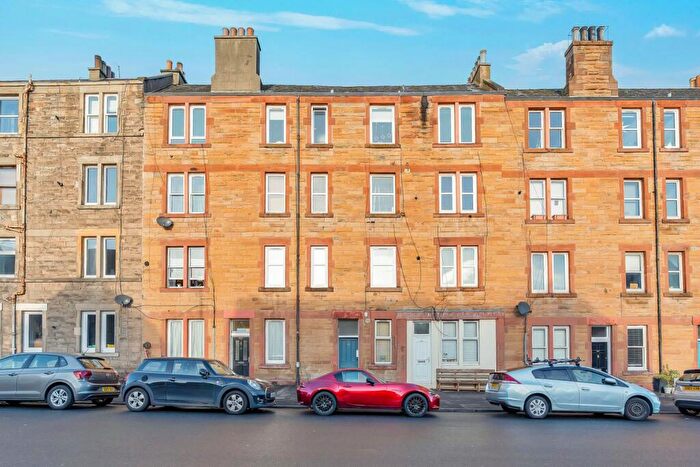

![]()
If you are looking to sell your house, let it out, or receive a property valuation, an expert can help you.
Click the button below to get started.
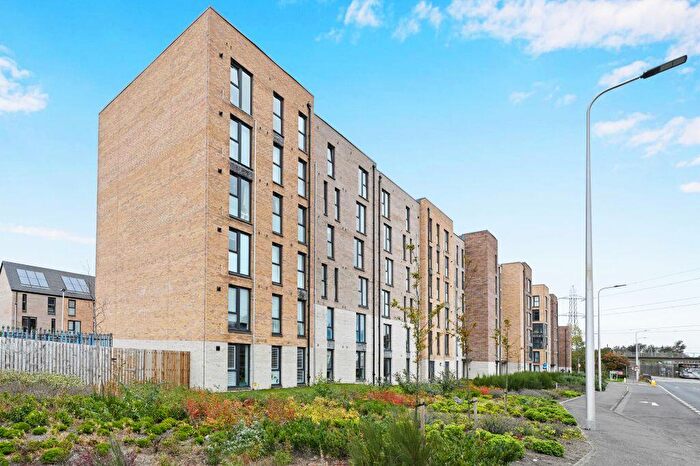
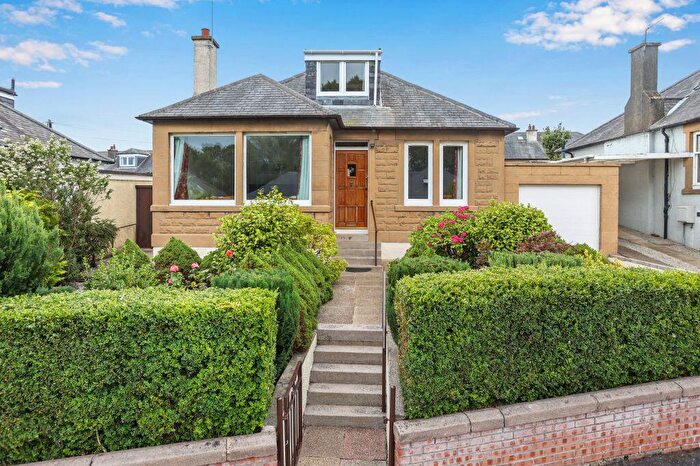
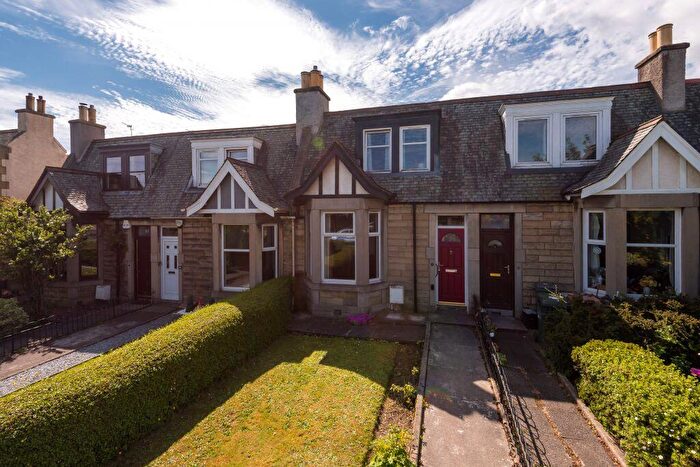
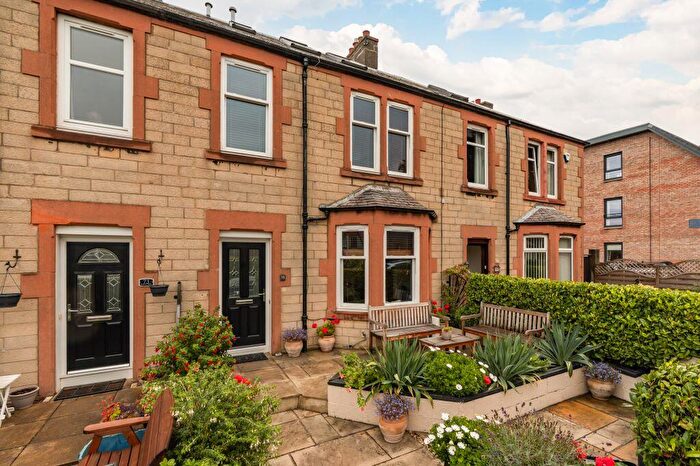
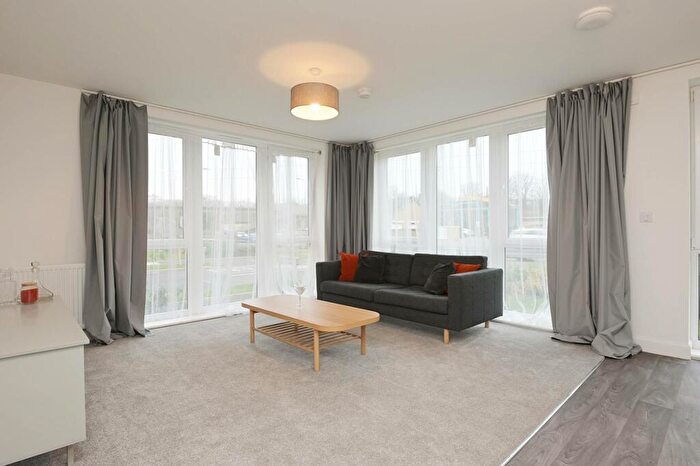
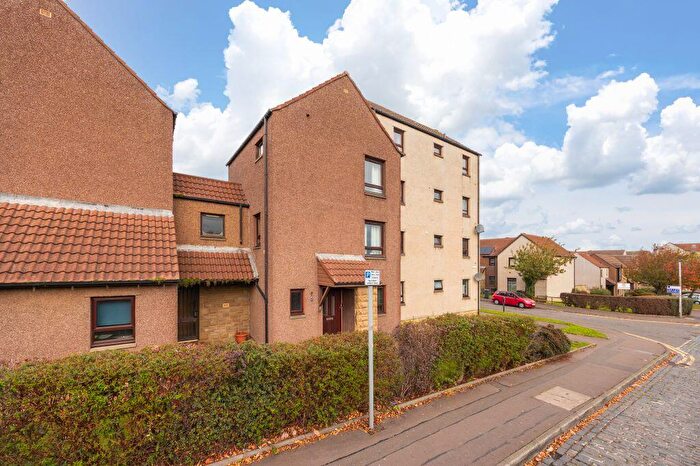
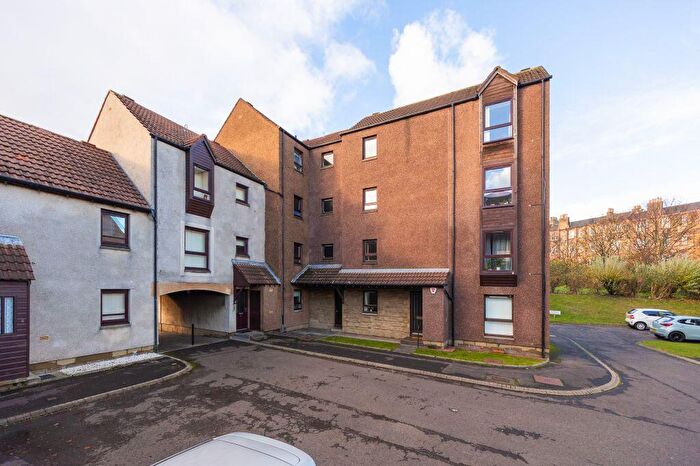
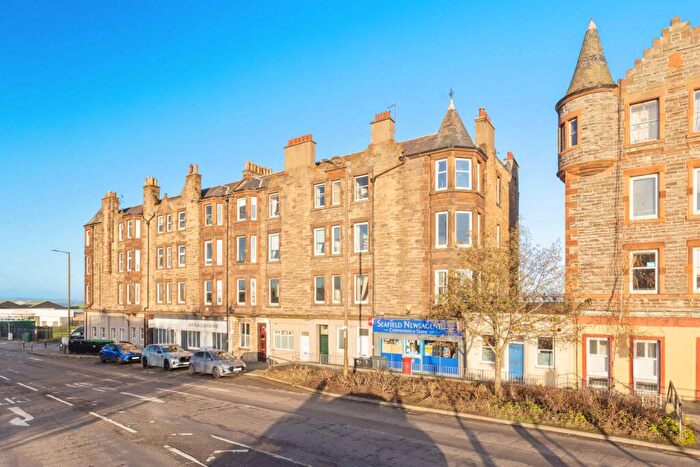
Previously listed properties near EH15 1DE, Portobello High Street
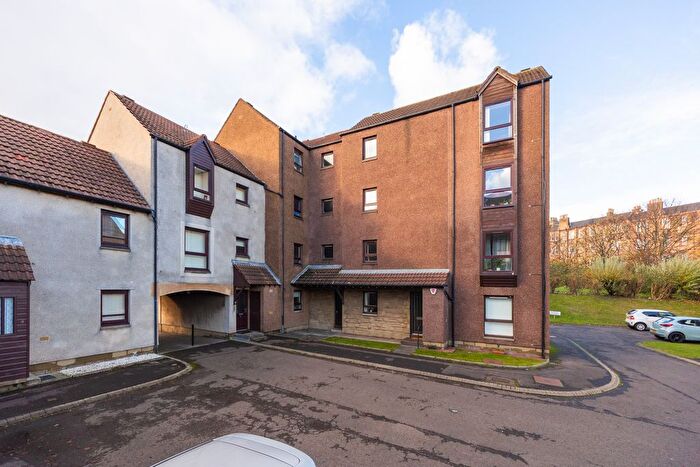
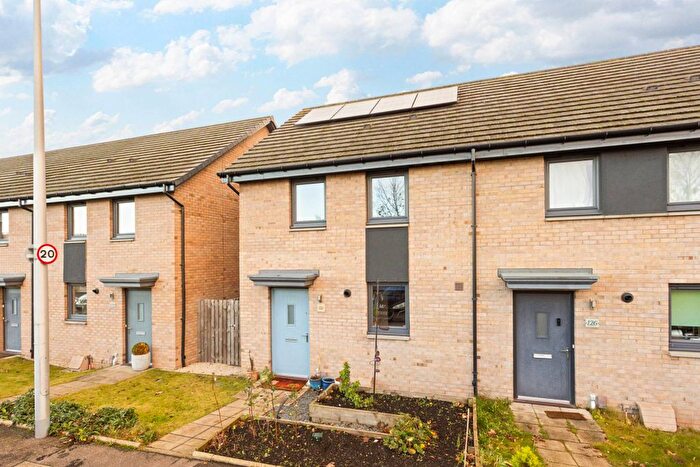
![]()
If you are looking to sell your house, let it out, or receive a property valuation, an expert can help you.
Click the button below to get started.
Price Paid in Portobello High Street, EH15 1DE, Portobello/Craigmillar
29 Portobello High Street, EH15 1DE, Portobello/Craigmillar Edinburgh
Property 29 has been sold 5 times. The last time it was sold was in 27/04/2022 and the sold price was £150,000.00.
This is a Property which was sold as an Established Building in 27/04/2022
| Date | Price | Classification |
|---|---|---|
| 27/04/2022 | £150,000.00 | Established Building |
| 14/12/2021 | £147,500.00 | Established Building |
| 16/08/2005 | £15,000.00 | Established Building |
| 18/07/2003 | £65,550.00 | Established Building |
| 09/08/2000 | £40,000.00 | Established Building |
29/6 Portobello High Street, EH15 1DE, Portobello/Craigmillar Edinburgh
Property 29/6 has been sold 1 time. The last time it was sold was in 13/07/2021 and the sold price was £112,500.00.
This is a Property which was sold as an Established Building in 13/07/2021
| Date | Price | Classification |
|---|---|---|
| 13/07/2021 | £112,500.00 | Established Building |
Postcodes in Portobello High Street, Portobello/Craigmillar
Navigate through other locations in Portobello High Street, Portobello/Craigmillar, Edinburgh to see more property listings for sale or to rent.
Transport near EH15 1DE, Portobello High Street

House price paid reports for EH15 1DE, Portobello High Street
Click on the buttons below to see price paid reports by year or property price:
- Price Paid By Year
Property Price Paid in EH15 1DE, Portobello High Street by Year
The average sold property price by year was:
| Year | Average Sold Price | Price Change |
Sold Properties
|
|---|---|---|---|
| 2022 | £150,000 | 13% |
1 Property |
| 2021 | £130,000 | 88% |
2 Properties |
| 2005 | £15,000 | -337% |
1 Property |
| 2003 | £65,550 | 39% |
1 Property |
| 2000 | £40,000 | - |
1 Property |