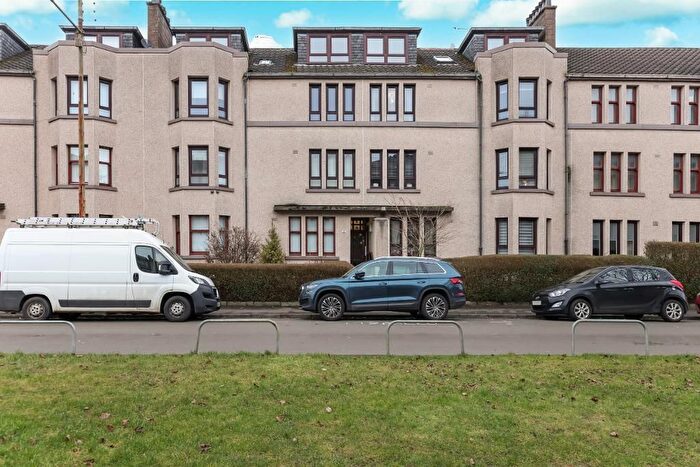
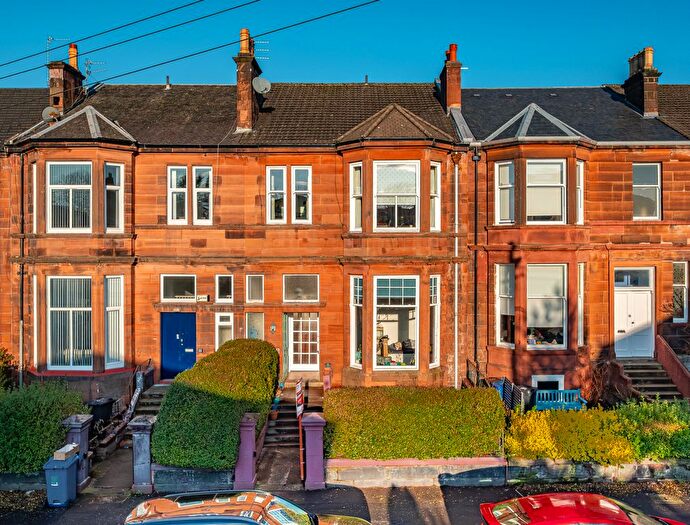
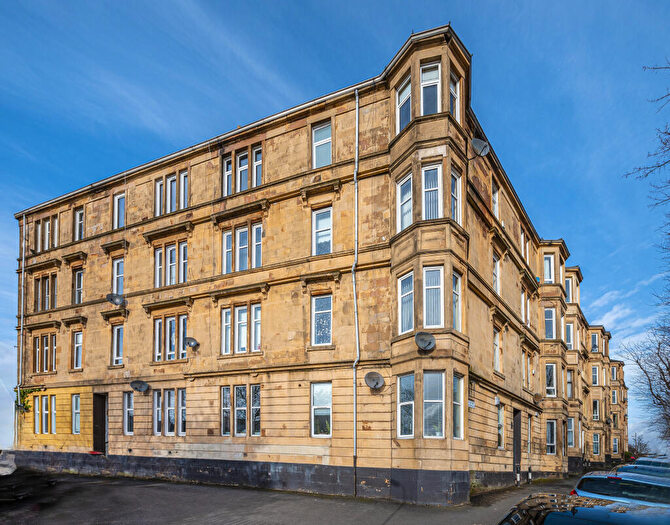
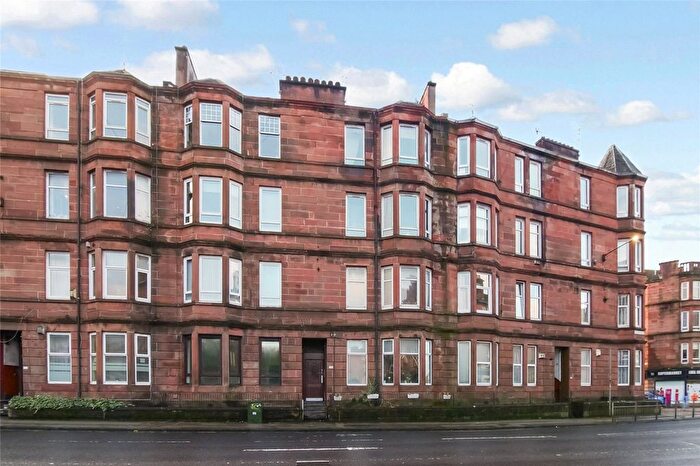
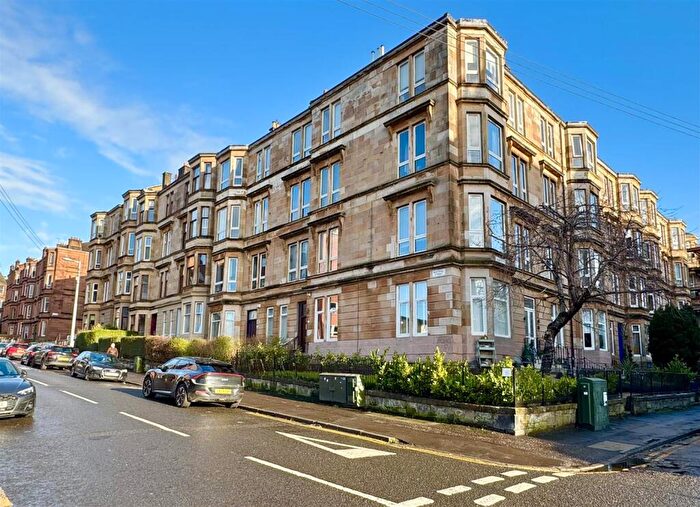
Houses for sale & to rent in G31 2TG, Craigpark Drive, Dennistoun, Glasgow
House Prices in G31 2TG, Craigpark Drive, Dennistoun
Properties in G31 2TG have no sales history available within the last 3 years. G31 2TG is a postcode in Craigpark Drive located in Dennistoun, an area in Glasgow, Glasgow City, with 6 households².
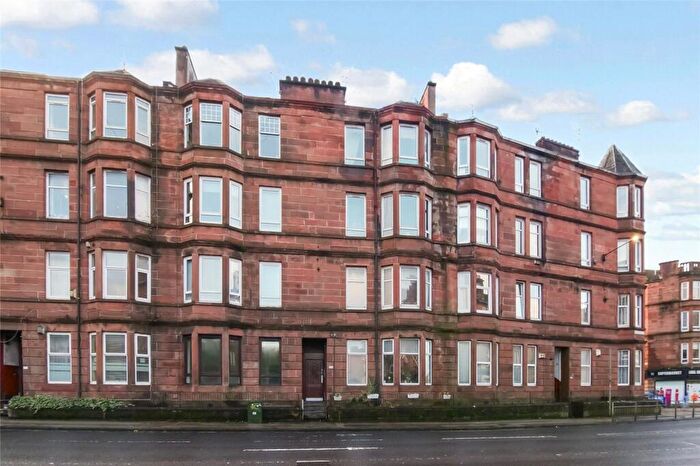
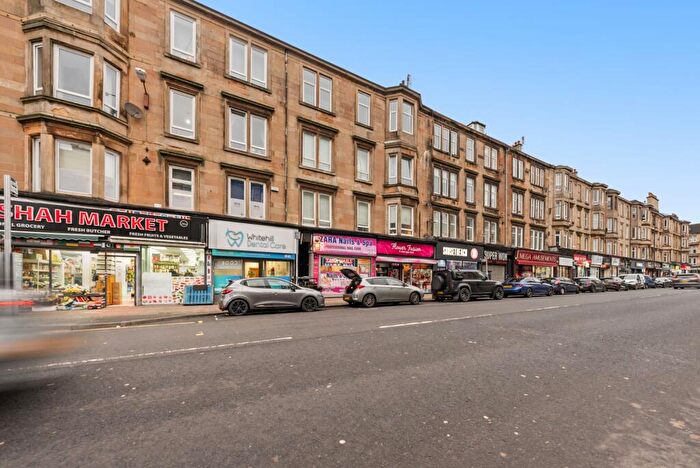
Properties for sale near G31 2TG, Craigpark Drive
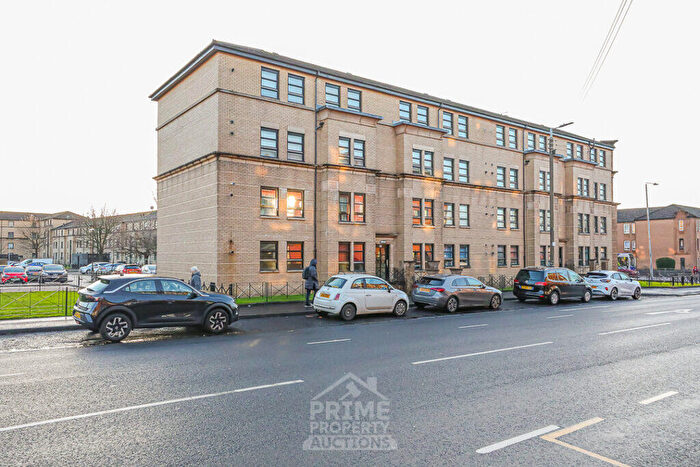
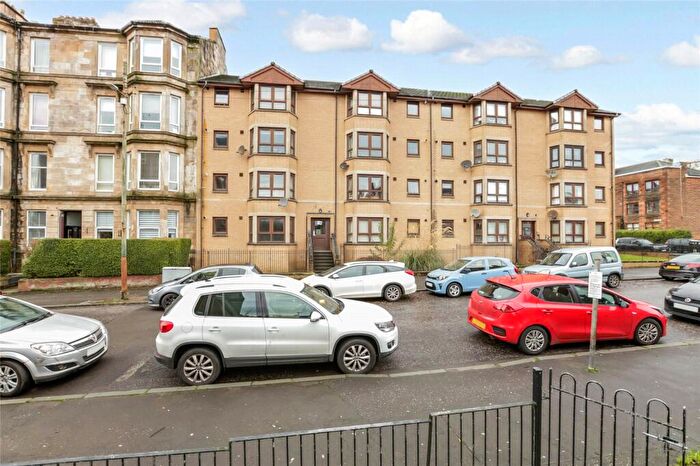
Previously listed properties near G31 2TG, Craigpark Drive
Price Paid in Craigpark Drive, G31 2TG, Dennistoun
239 Craigpark Drive, G31 2TG, Dennistoun Glasgow
Property 239 has been sold 5 times. The last time it was sold was in 15/09/2021 and the sold price was £164,500.00.
This is a Property which was sold as an Established Building in 15/09/2021
| Date | Price | Classification |
|---|---|---|
| 15/09/2021 | £164,500.00 | Established Building |
| 02/06/2017 | £125,000.00 | Established Building |
| 25/03/2016 | £120,562.00 | Established Building |
| 12/03/2009 | £105,000.00 | Established Building |
| 16/06/2006 | £95,000.00 | Established Building |
239 Flat 1/2 Craigpark Drive, G31 2TG, Dennistoun Glasgow
Property 239 Flat 1/2 has been sold 1 time. The last time it was sold was in 07/10/2002 and the sold price was £26,600.00.
This is a Property which was sold as an Established Building in 07/10/2002
| Date | Price | Classification |
|---|---|---|
| 07/10/2002 | £26,600.00 | Established Building |
Postcodes in Craigpark Drive, Dennistoun
Navigate through other locations in Craigpark Drive, Dennistoun, Glasgow to see more property listings for sale or to rent.
Transport near G31 2TG, Craigpark Drive
-
Alexandra Parade Station
-
Duke Street Station
-
Bellgrove Station
-
High Street Station
-
Bridgeton Station
-
Barnhill Station
-
Dalmarnock Station
-
Glasgow Queen Street Station
-
Argyle Street Station
-
Springburn Station
House price paid reports for G31 2TG, Craigpark Drive
Click on the buttons below to see price paid reports by year or property price:
- Price Paid By Year
Property Price Paid in G31 2TG, Craigpark Drive by Year
The average sold property price by year was:
| Year | Average Sold Price | Price Change |
Sold Properties
|
|---|---|---|---|
| 2021 | £164,500 | 24% |
1 Property |
| 2017 | £125,000 | 4% |
1 Property |
| 2016 | £120,562 | 13% |
1 Property |
| 2009 | £105,000 | 10% |
1 Property |
| 2006 | £95,000 | 72% |
1 Property |
| 2002 | £26,600 | - |
1 Property |

