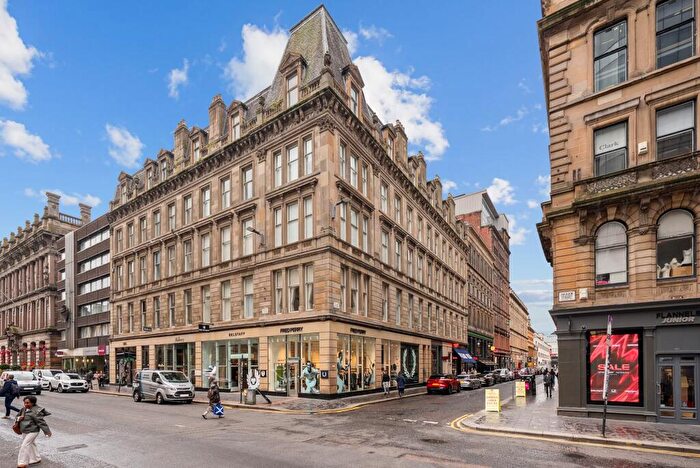
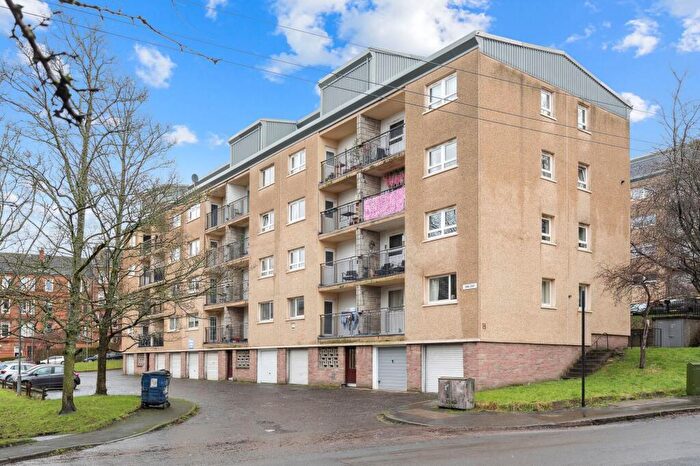
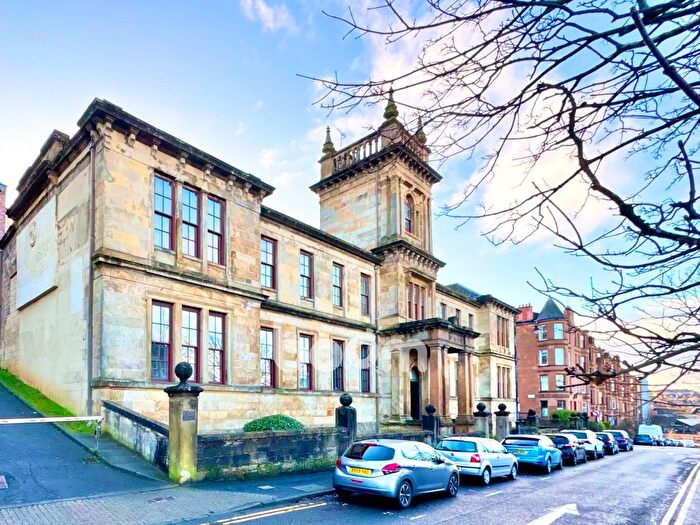
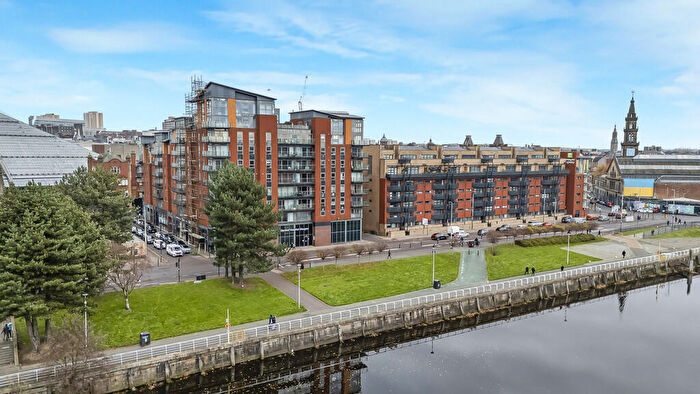
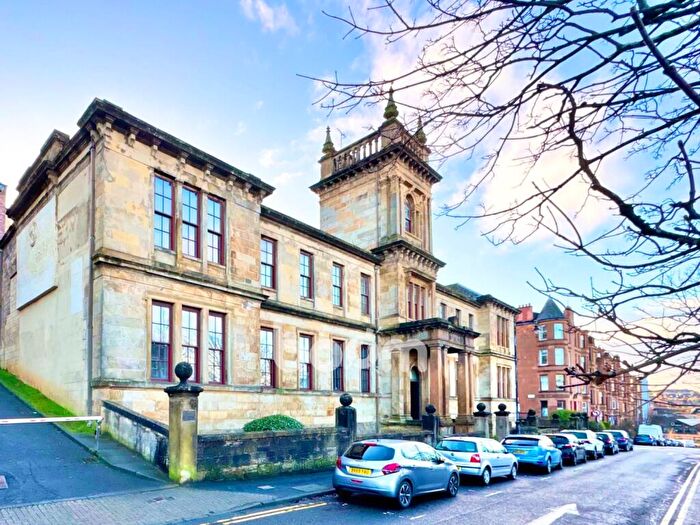
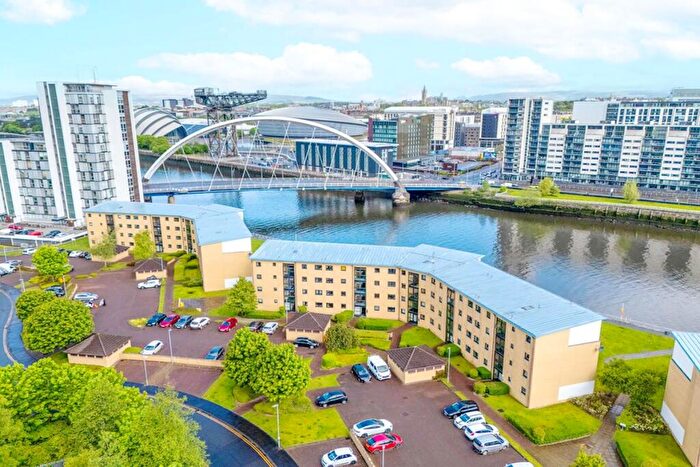
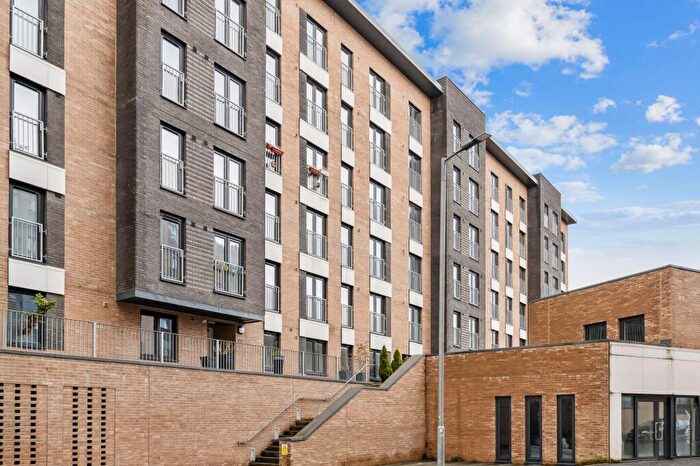
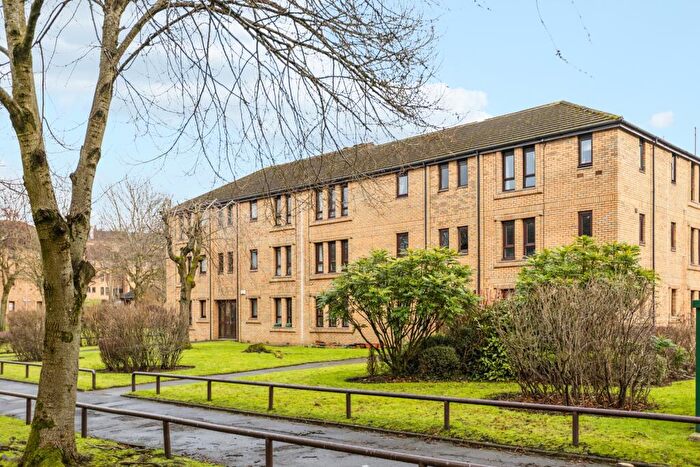
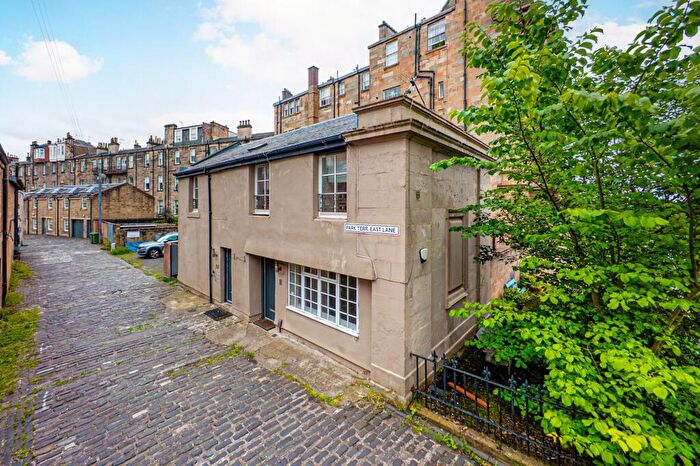
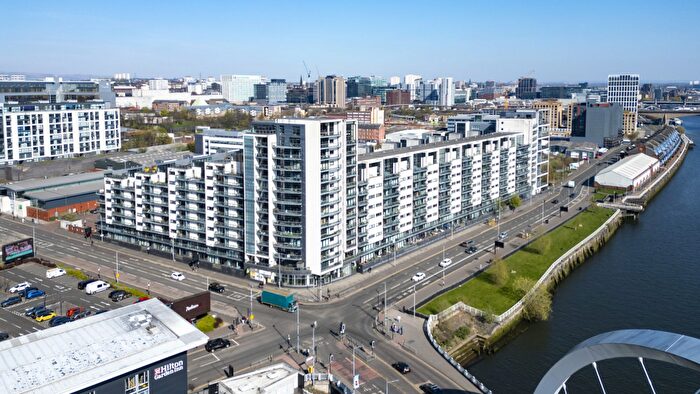
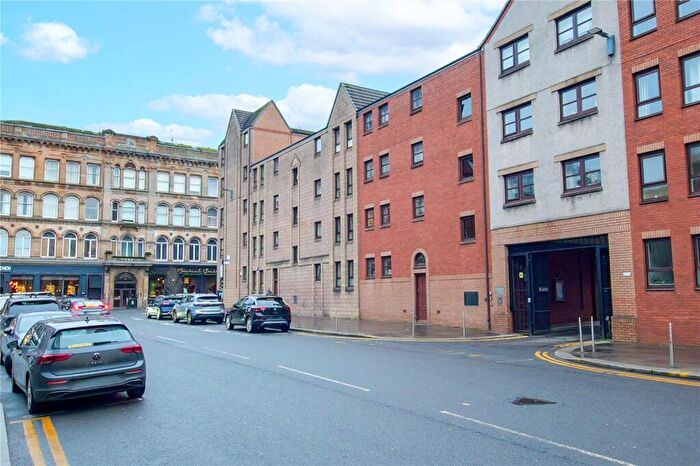
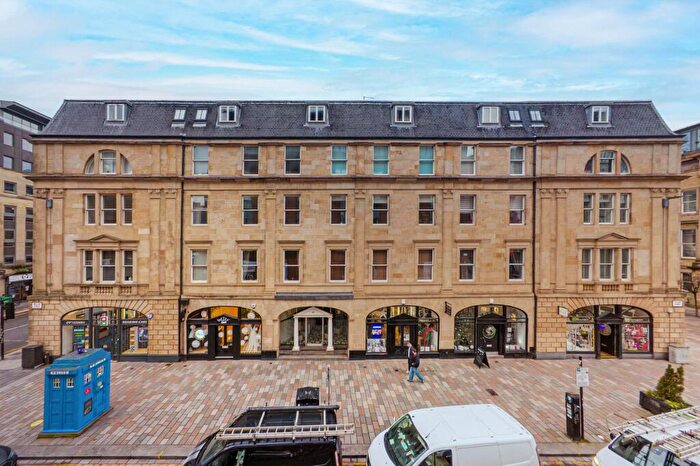
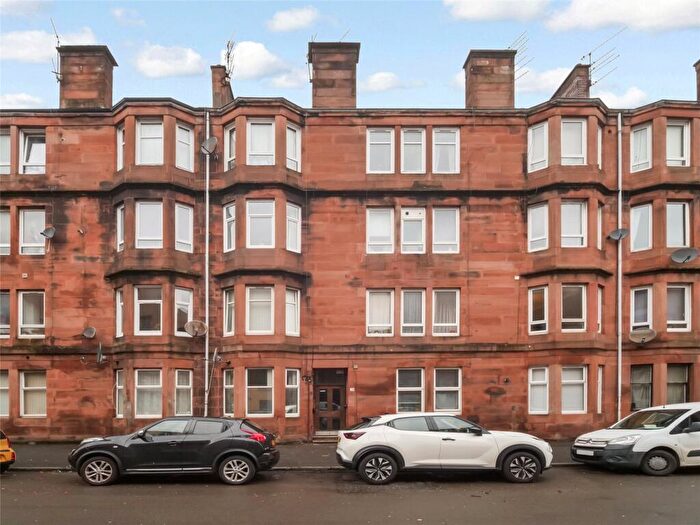
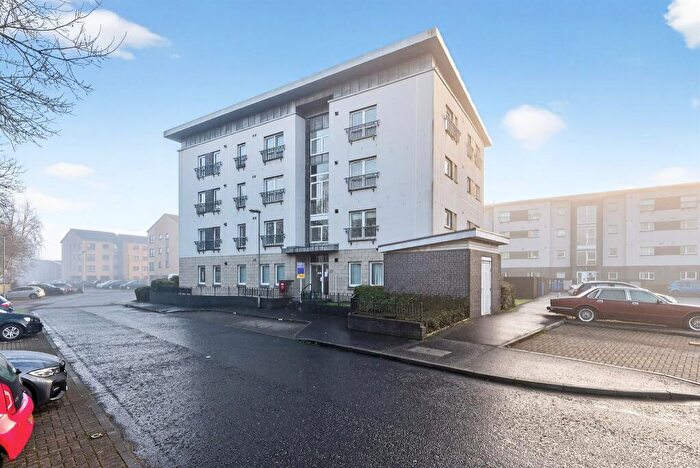
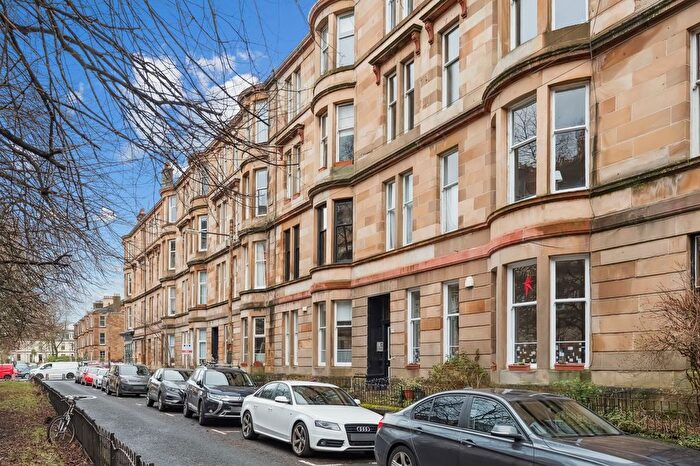
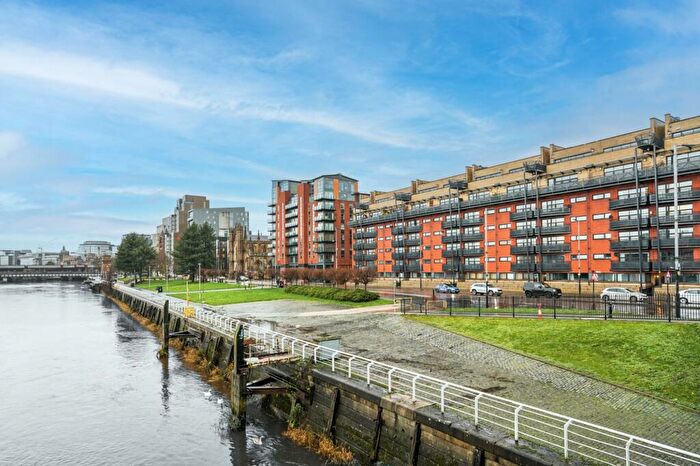
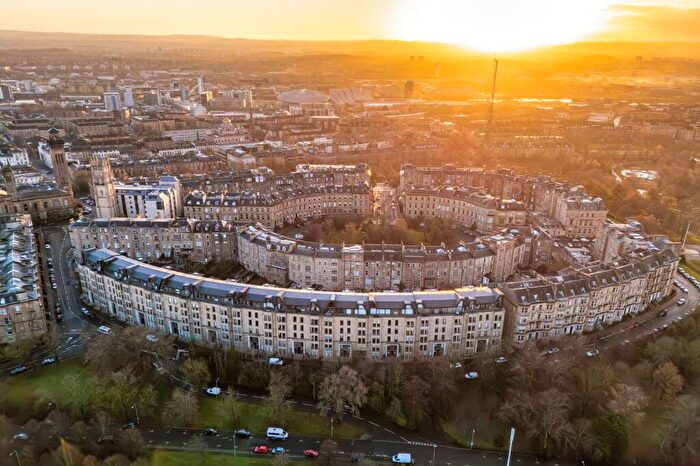
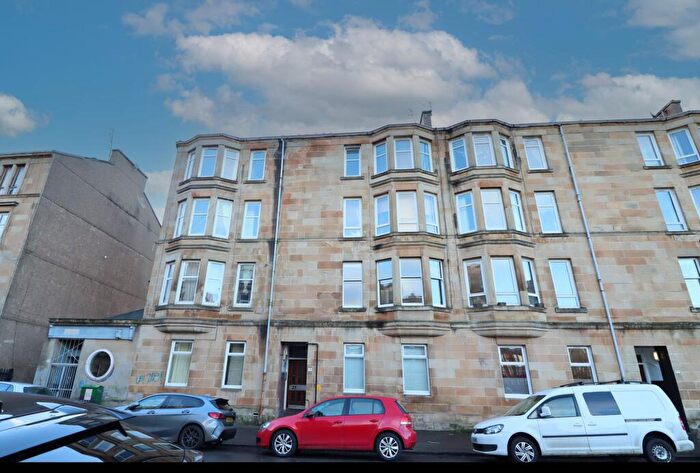
Houses for sale & to rent in Anderston/City/Yorkhill, Glasgow
House Prices in Anderston/City/Yorkhill
Properties in Anderston/City/Yorkhill have an average house price of £209,220.00 and had 794 Property Transactions within the last 3 years¹.
Anderston/City/Yorkhill is an area in Glasgow, Glasgow City with 13,651 households², where the most expensive property was sold for £1,030,000.00.
Properties for sale in Anderston/City/Yorkhill
Roads and Postcodes in Anderston/City/Yorkhill
Navigate through our locations to find the location of your next house in Anderston/City/Yorkhill, Glasgow for sale or to rent.
Transport near Anderston/City/Yorkhill
-
Glasgow Central Station
-
Glasgow Queen Street Station
-
Charing Cross (Glasgow) Station
-
Anderston Station
-
Argyle Street Station
-
High Street Station
-
Exhibition Centre Glasgow Station
-
Bellgrove Station
-
Pollokshields East Station
-
Bridgeton Station
- FAQ
- Price Paid By Year
Frequently asked questions about Anderston/City/Yorkhill
What is the average price for a property for sale in Anderston/City/Yorkhill?
The average price for a property for sale in Anderston/City/Yorkhill is £209,220. This amount is 8% higher than the average price in Glasgow. There are 6,596 property listings for sale in Anderston/City/Yorkhill.
Which train stations are available in or near Anderston/City/Yorkhill?
Some of the train stations available in or near Anderston/City/Yorkhill are Glasgow Central, Glasgow Queen Street and Charing Cross (Glasgow).
Property Price Paid in Anderston/City/Yorkhill by Year
The average sold property price by year was:
| Year | Average Sold Price | Price Change |
Sold Properties
|
|---|---|---|---|
| 2023 | £199,954 | -6% |
129 Properties |
| 2022 | £211,017 | 4% |
665 Properties |
| 2021 | £203,492 | 6% |
799 Properties |
| 2020 | £192,145 | 3% |
401 Properties |
| 2019 | £185,943 | 0,4% |
650 Properties |
| 2018 | £185,155 | 4% |
704 Properties |
| 2017 | £178,530 | 10% |
705 Properties |
| 2016 | £160,818 | 3% |
762 Properties |
| 2015 | £156,596 | 14% |
732 Properties |
| 2014 | £134,264 | -3% |
979 Properties |
| 2013 | £138,831 | -2% |
707 Properties |
| 2012 | £142,062 | -6% |
504 Properties |
| 2011 | £149,917 | -28% |
518 Properties |
| 2010 | £192,163 | -223% |
580 Properties |
| 2009 | £620,853 | 54% |
699 Properties |
| 2008 | £283,192 | 11% |
828 Properties |
| 2007 | £252,636 | -47% |
1,049 Properties |
| 2006 | £370,769 | -26% |
1,198 Properties |
| 2005 | £466,721 | 59% |
1,248 Properties |
| 2004 | £189,322 | -13% |
1,215 Properties |
| 2003 | £213,378 | -37% |
1,168 Properties |
| 2002 | £291,401 | 15% |
912 Properties |
| 2001 | £248,729 | - |
74 Properties |

