
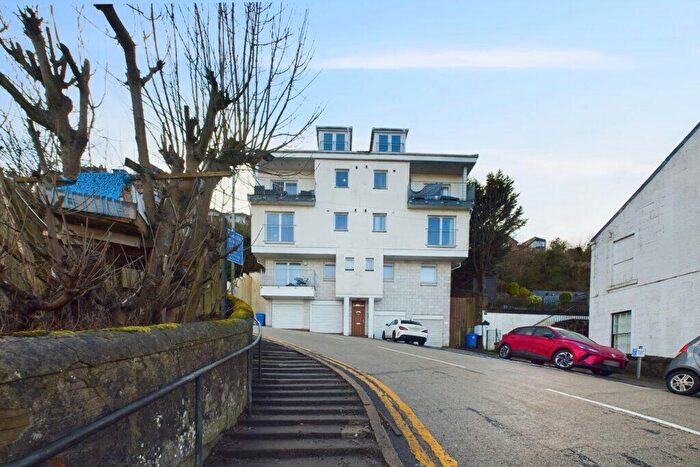
Houses for sale in Gourock, Inverclyde
House Prices in Gourock
Properties in Gourock have an average house price of £191k and had 235 Property Transactions within the last 3 years.¹
Gourock is an area in Inverclyde with 5,449 households², where the most expensive property was sold for £680k.
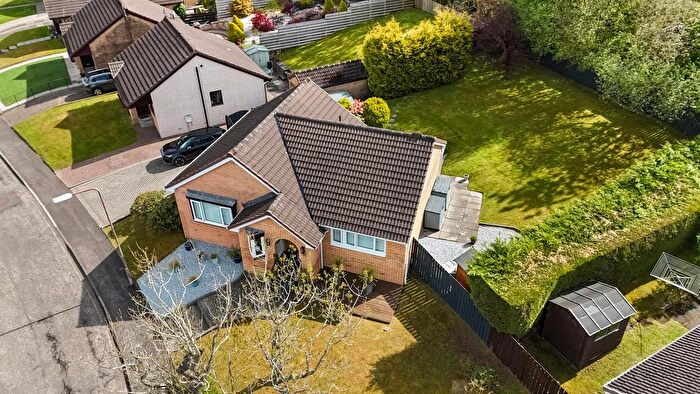
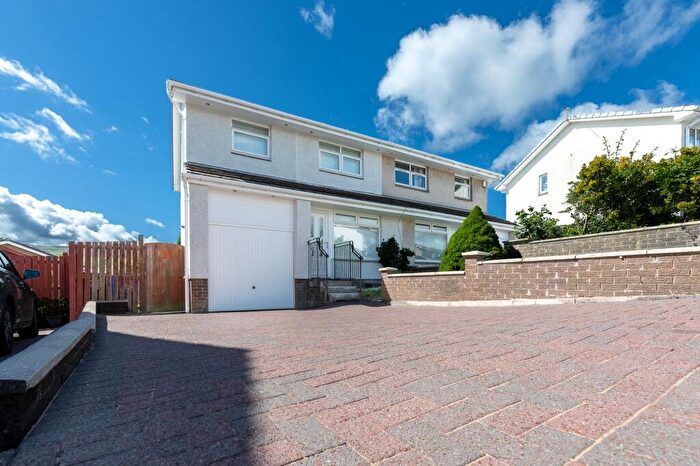
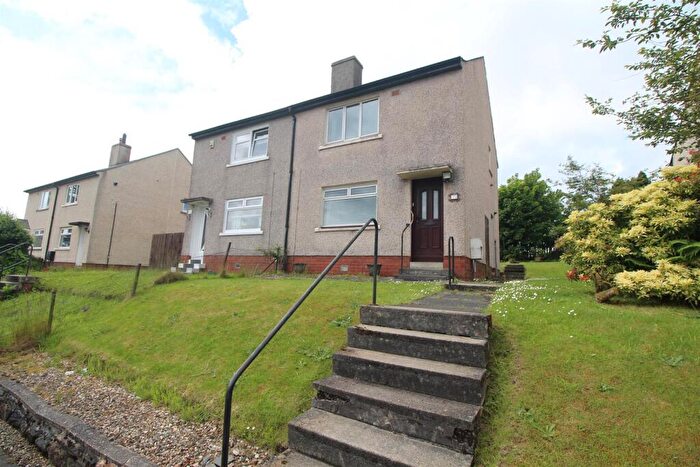
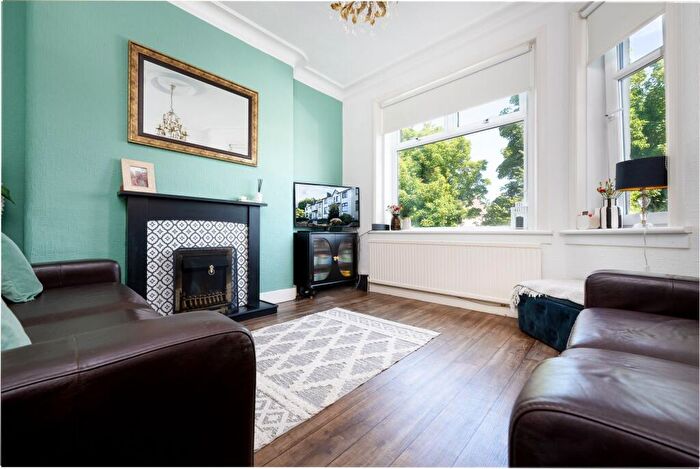
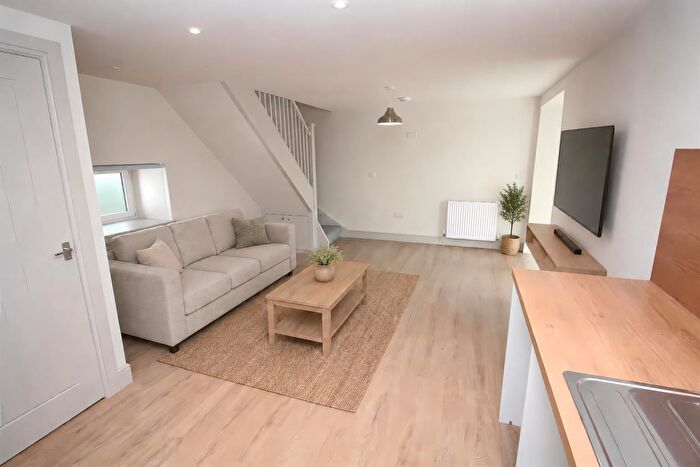
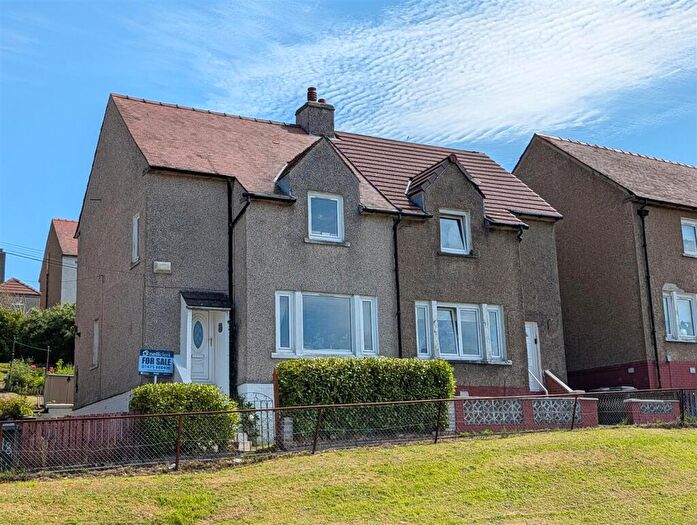
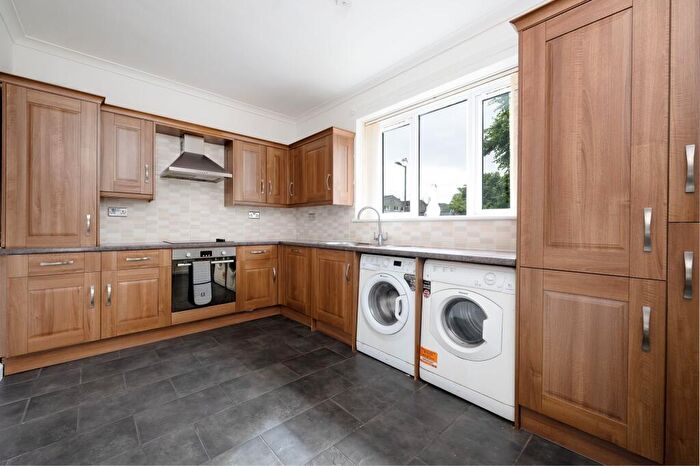
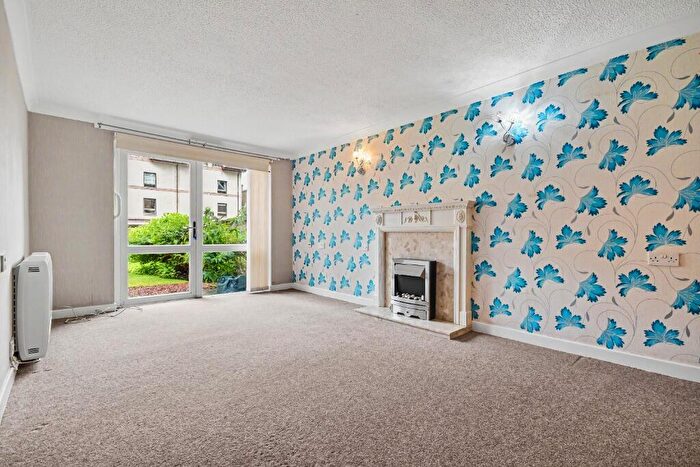
Properties for sale in Gourock
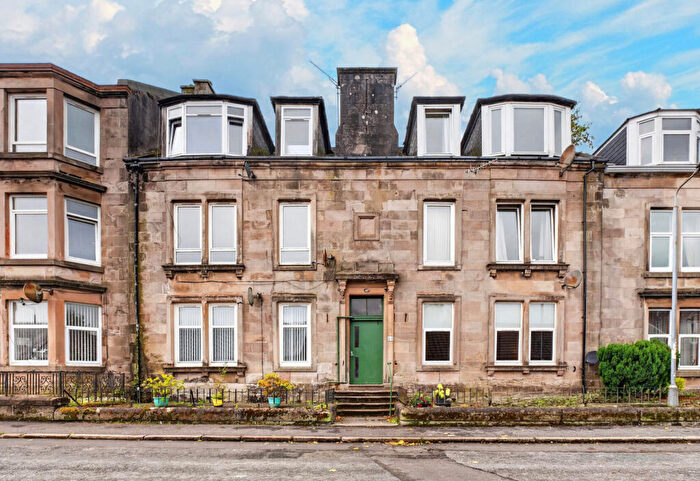
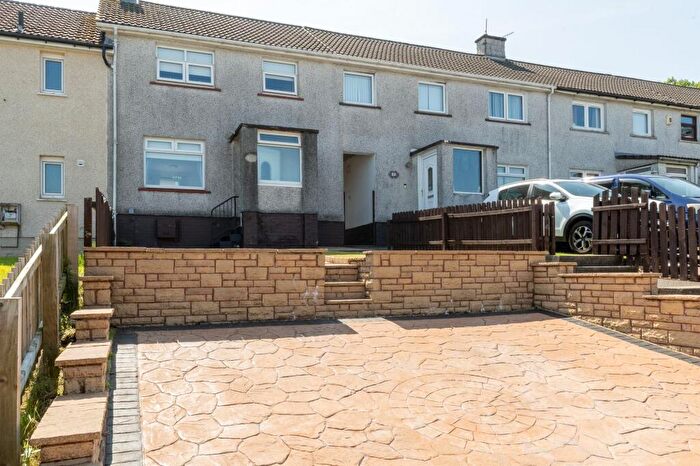
![]()
If you are looking to sell your house, let it out, or receive a property valuation, an expert can help you.
Click the button below to get started.
Previously listed properties in Gourock
Neighbourhoods in Gourock
Navigate through our locations to find the location of your next house in Gourock, Inverclyde for sale or to rent.
Property price trends in Gourock
According to the latest Registers of Scotland data, the average home in Gourock sold for £214,608 in 2025. That figure comes from a substantial record of 5,374 sales logged over the past 24 years.
Prices have continued to climb over the last three years. Compared with 2022, when the typical sale came in around £153,087, that's a rise of roughly 40.2%.
Looking back five years, average prices are up about 44.2% since 2020, a gain of around £65,748 in cash terms.
Zoom out to the past decade for the fuller picture. Back in 2015, homes here averaged £144,787, so the typical sold price has climbed about 48.2% since then, roughly 4% a year. Stretch the view to fifteen years and that annual pace eases back to about 3.7%.
Frequently asked questions about Gourock
What is the average price for a property for sale in Gourock?
The average price for a property for sale in Gourock is £191,024. This amount is 17% higher than the average price in Inverclyde. There are 1,176 property listings for sale in Gourock.
What locations have the most expensive properties for sale in Gourock?
The location with the most expensive properties for sale in Gourock is Inverclyde West at an average of £194,592.
What locations have the most affordable properties for sale in Gourock?
The location with the most affordable properties for sale in Gourock is Inverclyde South at an average of £145,266.
Which train stations are available in or near Gourock?
Some of the train stations available in or near Gourock are Gourock, Branchton and Fort Matilda.
Property Price Paid in Gourock by Year
The average sold property price by year was:
| Year | Average Sold Price | Price Change |
Sold Properties
|
|---|---|---|---|
| 2025 | £214,608 | -2% |
80 Properties |
| 2024 | £218,857 | 31% |
64 Properties |
| 2023 | £150,716 | -2% |
91 Properties |
| 2022 | £153,087 | -0,5% |
235 Properties |
| 2021 | £153,789 | 3% |
280 Properties |
| 2020 | £148,860 | 9% |
213 Properties |
| 2019 | £135,589 | -4% |
262 Properties |
| 2018 | £140,632 | 4% |
249 Properties |
| 2017 | £134,562 | 1% |
237 Properties |
| 2016 | £132,655 | -9% |
244 Properties |
Transport in Gourock
Please see below transportation links in this area:
