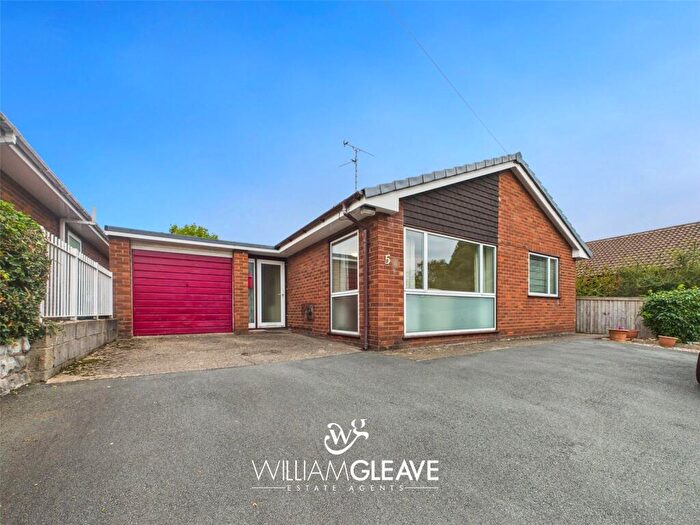
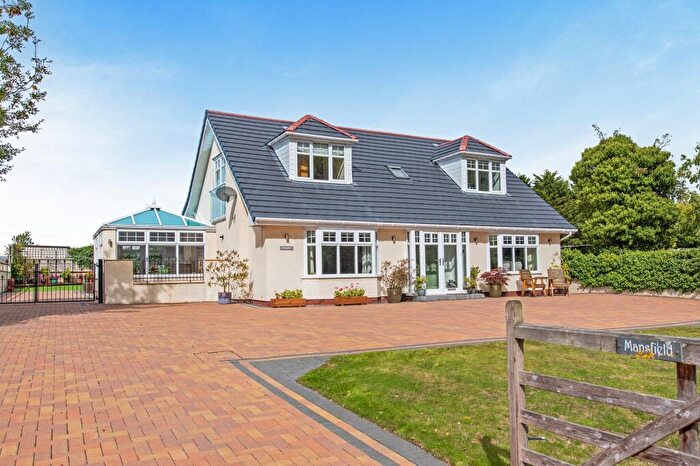
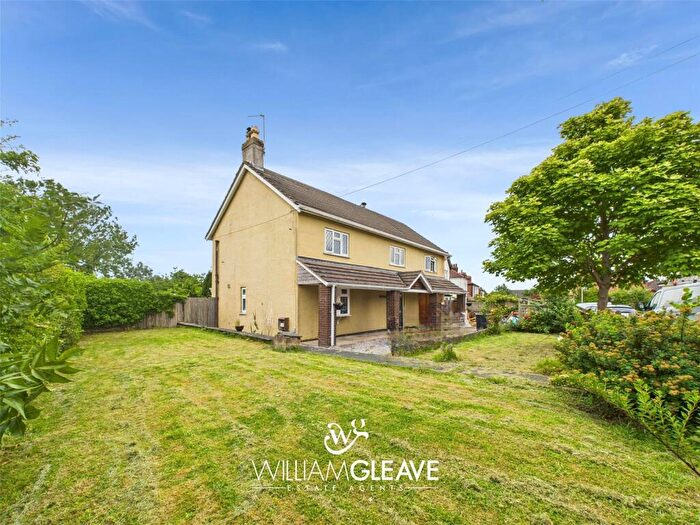
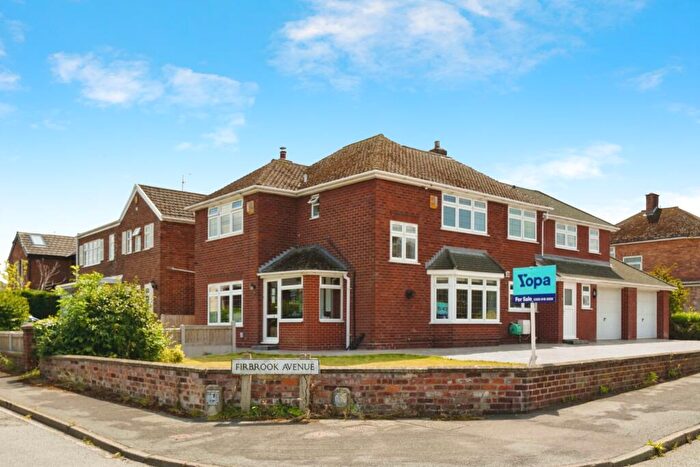
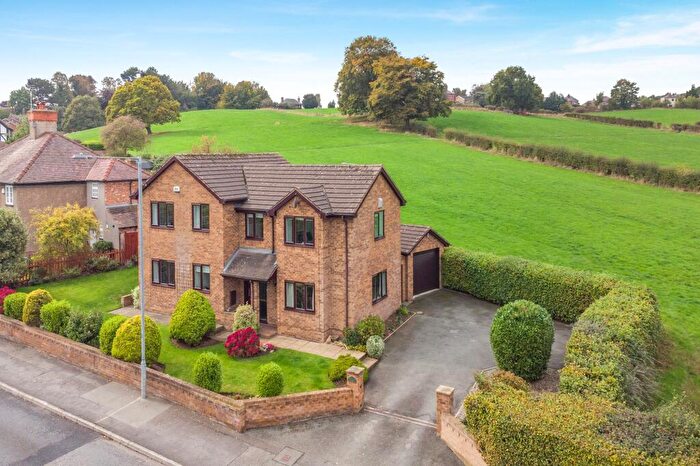
Houses for sale & to rent in Mancot, Deeside
House Prices in Mancot
Properties in Mancot have an average house price of £200,040.00 and had 105 Property Transactions within the last 3 years¹.
Mancot is an area in Deeside, Sir y Fflint - Flintshire with 1,513 households², where the most expensive property was sold for £510,000.00.
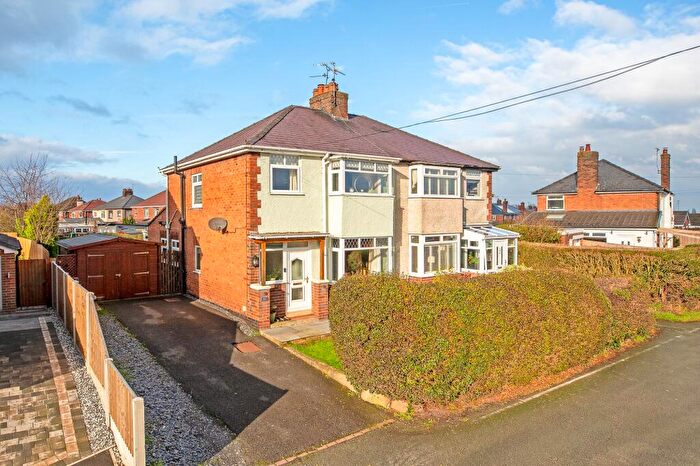
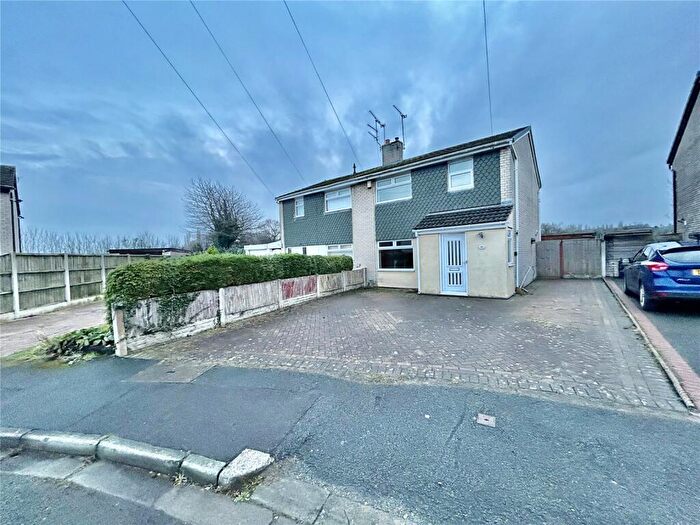
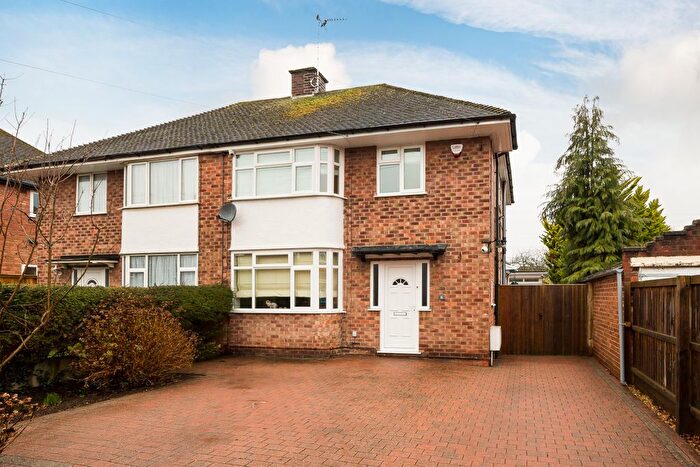
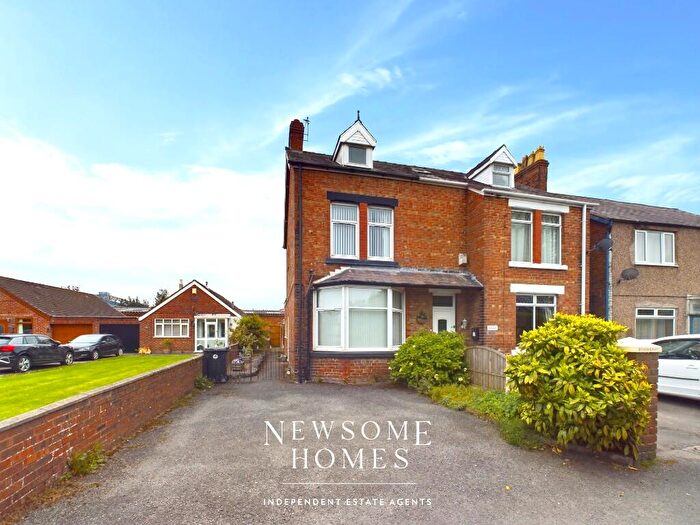
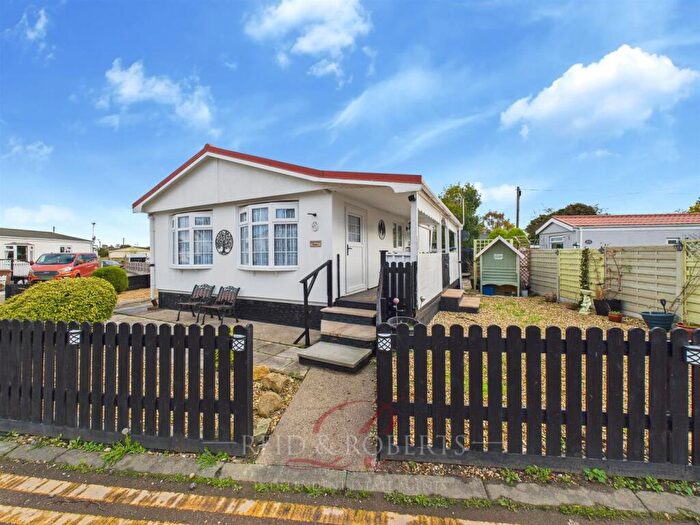
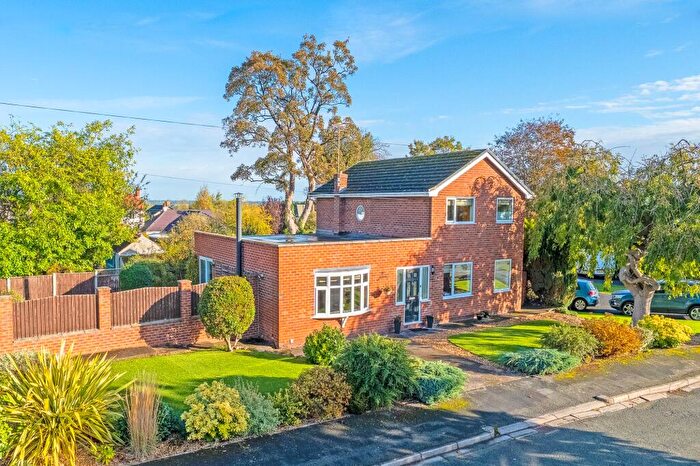
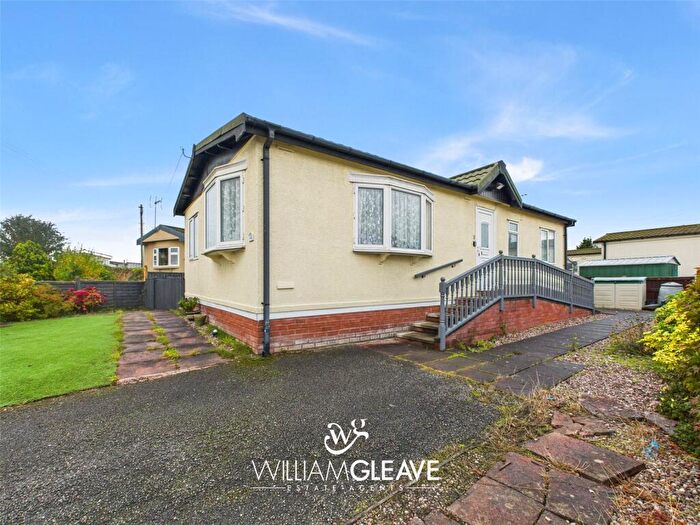
Properties for sale in Mancot
Roads and Postcodes in Mancot
Navigate through our locations to find the location of your next house in Mancot, Deeside for sale or to rent.
| Streets | Postcodes |
|---|---|
| Ash Lane | CH5 2BR |
| Ashfield Crescent | CH5 2AX |
| Ashlea Close | CH5 2BS |
| Banks Road | CH5 2BJ |
| Birch Croft | CH5 2BN |
| Brookleigh Avenue | CH5 2BB |
| Chester Road | CH5 2AA CH5 2EG CH5 2QL CH5 2QW |
| Clos Coed | CH5 2BD |
| Cottage Lane | CH5 2AZ CH5 2AY |
| Crofters Way | CH5 2BG |
| Crossways | CH5 2AN |
| Cwrt Onnen | CH5 2EE |
| Cwrt Rhos Lan | CH5 2BU |
| Deiniols Road | CH5 2ER CH5 2ES |
| Duckers Lane | CH5 2ED |
| Dyfed Drive | CH5 2FB |
| Earles Crescent | CH5 2EQ |
| Elm Croft | CH5 2BZ |
| Field View | CH5 2EY |
| Foxes Close | CH5 2EX |
| Gladstone Way | CH5 3HF |
| Glynne Way | CH5 3PA |
| Grange Court | CH5 2EZ |
| Hampton Avenue | CH5 2AG |
| Hawarden Way | CH5 2EL CH5 2EN CH5 2EW CH5 2EP |
| Kennedy Drive | CH5 3HX |
| Leaches Close | CH5 2EF |
| Leaches Lane | CH5 2BL CH5 2EH CH5 2EJ |
| Mancot Lane | CH5 2AH |
| Mancot Royal Close | CH5 2AF |
| Mancot Way | CH5 2AP CH5 2AW |
| Marnel Drive | CH5 2AE |
| Maxwell Avenue | CH5 2AT |
| Mechanics Lane | CH5 2AB |
| Moor Lane | CH5 3PF CH5 3PQ |
| Oak Court | CH5 2DX |
| Oak Villas | CH5 2BA |
| Oakley Road | CH5 2ET |
| Orchard Close | CH5 2AS |
| Park Avenue | CH5 3HY CH5 3HZ |
| Pembroke Close | CH5 2FE |
| Powys Close | CH5 2FA |
| Prince William Gardens | CH5 2BW |
| Radnor Close | CH5 2FD |
| Rake Lane | CH5 3PN |
| Ratcliffe Row | CH5 2DY |
| Rhesdai Penarlag | CH5 2GB |
| Rosslyn Close | CH5 3PG |
| Scotch Row | CH5 2BP |
| Scots Road | CH5 2BH |
| Sunnyside | CH5 2BE |
| The Green | CH5 2AJ |
| The Nook | CH5 2BQ |
| The Paddock | CH5 2AR |
| Wenlock Crescent | CH5 2BF |
| West Way | CH5 2EU |
| Willow Lane | CH5 2AD |
| Willow Park | CH5 2TT CH5 2TX CH5 2TY CH5 2TZ |
| Wilton Road | CH5 2AU |
| Woodlands Court | CH5 2BY |
| Woodville | CH5 2BX |
Transport near Mancot
- FAQ
- Price Paid By Year
- Property Type Price
Frequently asked questions about Mancot
What is the average price for a property for sale in Mancot?
The average price for a property for sale in Mancot is £200,040. This amount is 4% lower than the average price in Deeside. There are 298 property listings for sale in Mancot.
What streets have the most expensive properties for sale in Mancot?
The streets with the most expensive properties for sale in Mancot are Oak Court at an average of £305,000, Crofters Way at an average of £285,000 and Elm Croft at an average of £284,275.
What streets have the most affordable properties for sale in Mancot?
The streets with the most affordable properties for sale in Mancot are Foxes Close at an average of £139,800, Chester Road at an average of £141,666 and Field View at an average of £142,000.
Which train stations are available in or near Mancot?
Some of the train stations available in or near Mancot are Hawarden, Shotton and Hawarden Bridge.
Property Price Paid in Mancot by Year
The average sold property price by year was:
| Year | Average Sold Price | Price Change |
Sold Properties
|
|---|---|---|---|
| 2025 | £196,891 | 5% |
25 Properties |
| 2024 | £187,288 | -15% |
40 Properties |
| 2023 | £214,760 | 14% |
40 Properties |
| 2022 | £185,421 | -12% |
38 Properties |
| 2021 | £207,912 | 20% |
57 Properties |
| 2020 | £165,322 | 8% |
37 Properties |
| 2019 | £152,902 | -10% |
46 Properties |
| 2018 | £167,713 | -2% |
37 Properties |
| 2017 | £170,645 | 1% |
57 Properties |
| 2016 | £169,763 | 14% |
48 Properties |
| 2015 | £145,382 | -1% |
51 Properties |
| 2014 | £146,152 | 10% |
40 Properties |
| 2013 | £131,326 | -17% |
41 Properties |
| 2012 | £153,115 | -3% |
25 Properties |
| 2011 | £157,861 | 5% |
22 Properties |
| 2010 | £149,447 | 9% |
27 Properties |
| 2009 | £136,296 | -15% |
16 Properties |
| 2008 | £156,735 | -2% |
23 Properties |
| 2007 | £159,102 | 14% |
60 Properties |
| 2006 | £136,505 | 7% |
57 Properties |
| 2005 | £127,632 | -3% |
46 Properties |
| 2004 | £130,838 | 27% |
39 Properties |
| 2003 | £95,763 | 17% |
48 Properties |
| 2002 | £79,384 | 23% |
47 Properties |
| 2001 | £61,502 | 7% |
68 Properties |
| 2000 | £57,264 | -6% |
41 Properties |
| 1999 | £60,483 | 6% |
34 Properties |
| 1998 | £56,664 | 7% |
49 Properties |
| 1997 | £52,574 | 11% |
58 Properties |
| 1996 | £46,965 | 2% |
41 Properties |
| 1995 | £46,125 | - |
33 Properties |
Property Price per Property Type in Mancot
Here you can find historic sold price data in order to help with your property search.
The average Property Paid Price for specific property types in the last three years are:
| Property Type | Average Sold Price | Sold Properties |
|---|---|---|
| Semi Detached House | £196,918.00 | 47 Semi Detached Houses |
| Detached House | £288,001.00 | 21 Detached Houses |
| Terraced House | £160,135.00 | 30 Terraced Houses |
| Flat | £128,142.00 | 7 Flats |

