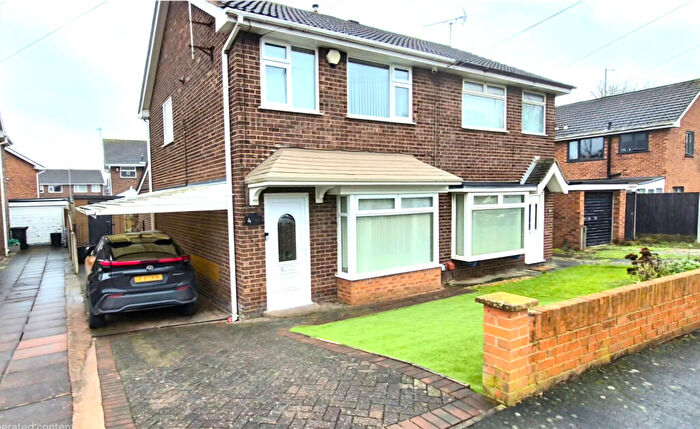
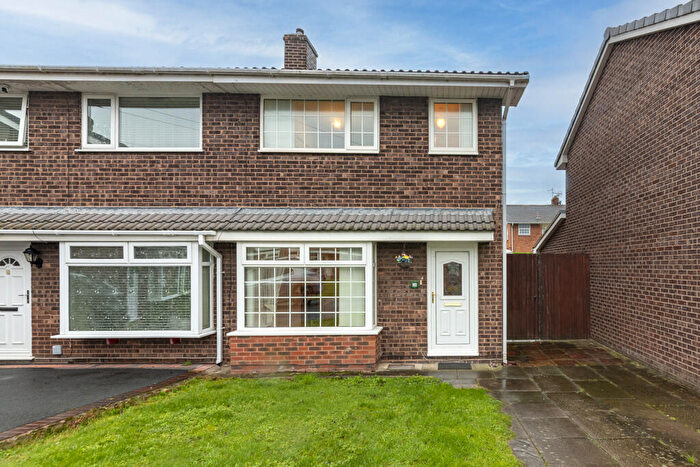
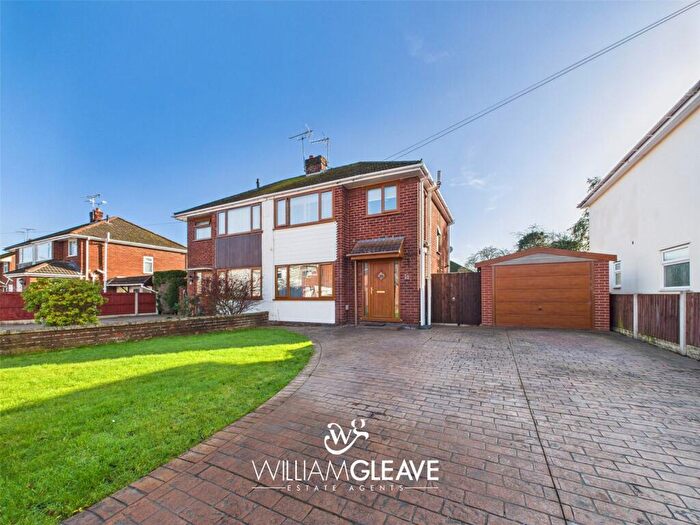
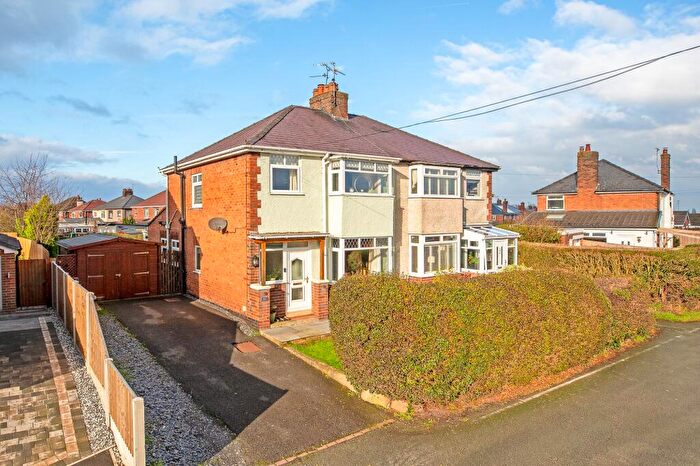
Houses for sale & to rent in Queensferry, Deeside
House Prices in Queensferry
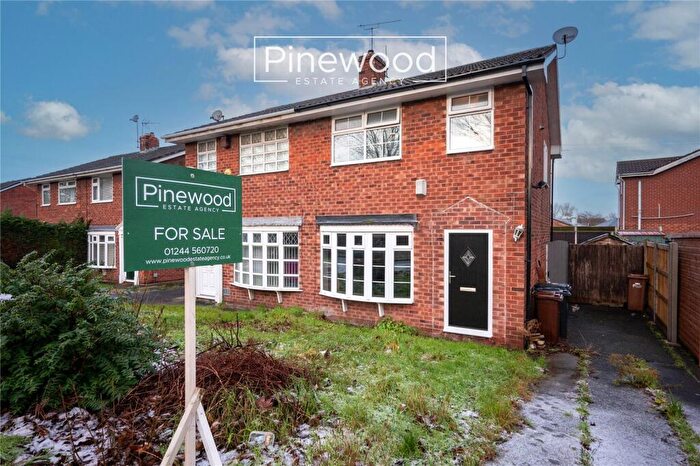
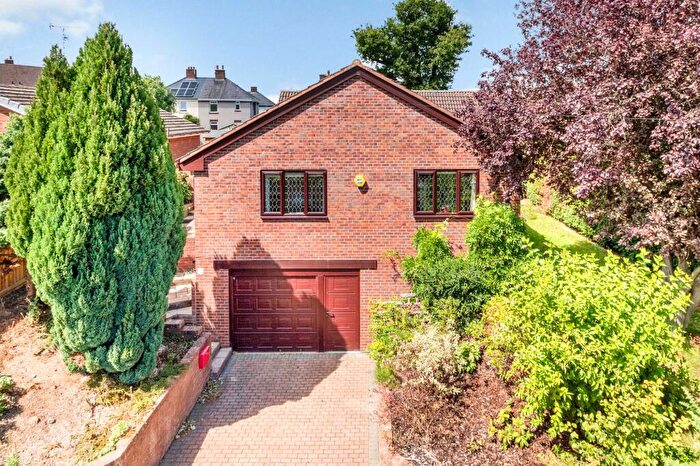
Properties in Queensferry have an average house price of £141,135.00 and had 88 Property Transactions within the last 3 years¹.
Queensferry is an area in Deeside, Sir y Fflint - Flintshire with 928 households², where the most expensive property was sold for £390,000.00.
Properties for sale in Queensferry
Roads and Postcodes in Queensferry
Navigate through our locations to find the location of your next house in Queensferry, Deeside for sale or to rent.
| Streets | Postcodes |
|---|---|
| Alvis Road | CH5 2QB |
| Babbage Road | CH5 2QD |
| Belvedere Close | CH5 1TG |
| Bernsdale Close | CH5 2QA |
| Bernsdale Court | CH5 2AL |
| Browns Place | CH5 2PU |
| By Pass Road | CH5 2DU |
| Chemistry Lane | CH5 2DA |
| Chester Road | CH5 2DT CH5 2DZ CH5 2EA CH5 2QN CH5 2DJ CH5 2DQ |
| Chester Road East | CH5 1TD |
| Chester Road West | CH5 1SA |
| Church View | CH5 2DP |
| Clair Avenue | CH5 2PQ |
| Connah's Quay | CH5 9EP |
| Crofters Park | CH5 2UW |
| Dundas Street | CH5 1SZ |
| Evansleigh Drive | CH5 2PG |
| Expressway Business Park | CH5 2TF CH5 2ZA |
| Factory Road | CH5 2DD CH5 2FF CH5 2QJ |
| Fairfield Road | CH5 1SS |
| Fairway | CH5 2PJ |
| Ffordd Pentre | CH5 2DW |
| Gladstone Street | CH5 1ST |
| Gladstone Terrace | CH5 2DR |
| Glendale Avenue | CH5 2QP |
| Glendale Avenue Industrial Estate | CH5 2DL |
| Glynne Street | CH5 1TA |
| Gun Cotton Place | CH5 2RE |
| Hamilton Avenue | CH5 2PA CH5 2PB |
| Harrison Grove | CH5 2PH |
| Hurlbutts Drive | CH5 1SF |
| Kings Court | CH5 2FG |
| Lawrence Street | CH5 2PF |
| Mold Road | CH5 1TF |
| North Street | CH5 2PP |
| Philip Street | CH5 2PS |
| Phoenix Street | CH5 2PD CH5 2PE |
| Pierce Street | CH5 1SY |
| Prince William Avenue | CH5 2QZ |
| Queen Street | CH5 1TB |
| Queens Avenue | CH5 2PR |
| Railway Terrace | CH5 2QF |
| Rectors Lane | CH5 2DH CH5 2DN |
| Saltney Terrace | CH5 2DS |
| St Ives Park | CH5 2QX |
| St Ives Way | CH5 2QS |
| Station Road | CH5 1SU CH5 1SX CH5 2PT CH5 2PZ CH5 2QG CH5 2QH CH5 2QQ CH5 1SR CH5 2PW CH5 2QU CH5 2TA CH5 2TB CH5 2TE |
| The Mews | CH5 1SW |
| Watkin Street | CH5 2PN |
| Whittle Close | CH5 2QE |
| Wood Street | CH5 2PL |
| CH5 9AD CH5 9AN CH5 9BW CH5 9EA CH5 9EH CH5 9ES CH5 9EU CH5 9EW CH5 9EX CH5 9EY CH5 9FA CH5 9FB |
Transport near Queensferry
- FAQ
- Price Paid By Year
- Property Type Price
Frequently asked questions about Queensferry
What is the average price for a property for sale in Queensferry?
The average price for a property for sale in Queensferry is £141,135. This amount is 33% lower than the average price in Deeside. There are 412 property listings for sale in Queensferry.
What streets have the most expensive properties for sale in Queensferry?
The streets with the most expensive properties for sale in Queensferry are Harrison Grove at an average of £190,000, Chester Road at an average of £184,000 and Hamilton Avenue at an average of £180,250.
What streets have the most affordable properties for sale in Queensferry?
The streets with the most affordable properties for sale in Queensferry are Pierce Street at an average of £103,250, Railway Terrace at an average of £110,000 and Church View at an average of £110,583.
Which train stations are available in or near Queensferry?
Some of the train stations available in or near Queensferry are Shotton, Hawarden Bridge and Hawarden.
Property Price Paid in Queensferry by Year
The average sold property price by year was:
| Year | Average Sold Price | Price Change |
Sold Properties
|
|---|---|---|---|
| 2025 | £145,658 | 8% |
28 Properties |
| 2024 | £133,446 | -9% |
33 Properties |
| 2023 | £145,842 | -8% |
27 Properties |
| 2022 | £157,858 | 14% |
24 Properties |
| 2021 | £135,470 | 14% |
52 Properties |
| 2020 | £116,818 | -36% |
29 Properties |
| 2019 | £158,577 | 26% |
27 Properties |
| 2018 | £117,060 | 7% |
24 Properties |
| 2017 | £109,031 | 0,4% |
32 Properties |
| 2016 | £108,642 | 8% |
21 Properties |
| 2015 | £100,451 | -2% |
30 Properties |
| 2014 | £102,949 | 8% |
22 Properties |
| 2013 | £94,326 | -6% |
13 Properties |
| 2012 | £99,923 | -15% |
13 Properties |
| 2011 | £114,442 | 19% |
13 Properties |
| 2010 | £93,000 | -43% |
11 Properties |
| 2009 | £132,687 | 4% |
8 Properties |
| 2008 | £128,000 | -1% |
16 Properties |
| 2007 | £129,170 | 14% |
48 Properties |
| 2006 | £111,310 | 7% |
43 Properties |
| 2005 | £103,190 | 14% |
37 Properties |
| 2004 | £88,623 | 17% |
46 Properties |
| 2003 | £73,857 | 15% |
41 Properties |
| 2002 | £62,514 | 25% |
57 Properties |
| 2001 | £46,577 | 12% |
43 Properties |
| 2000 | £41,117 | 2% |
39 Properties |
| 1999 | £40,125 | 11% |
20 Properties |
| 1998 | £35,532 | -13% |
29 Properties |
| 1997 | £40,129 | 15% |
29 Properties |
| 1996 | £33,991 | -11% |
29 Properties |
| 1995 | £37,748 | - |
27 Properties |
Property Price per Property Type in Queensferry
Here you can find historic sold price data in order to help with your property search.
The average Property Paid Price for specific property types in the last three years are:
| Property Type | Average Sold Price | Sold Properties |
|---|---|---|
| Semi Detached House | £161,576.00 | 23 Semi Detached Houses |
| Detached House | £180,000.00 | 10 Detached Houses |
| Terraced House | £126,587.00 | 54 Terraced Houses |
| Flat | £68,000.00 | 1 Flat |


