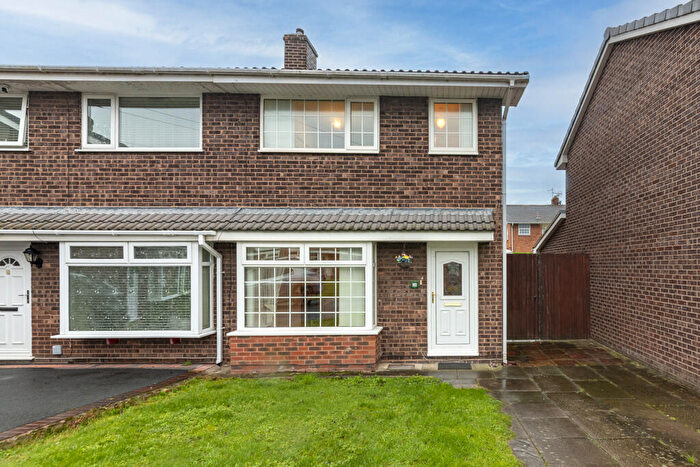
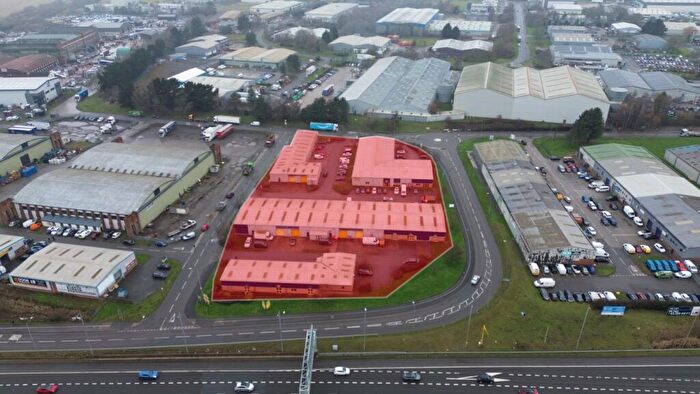
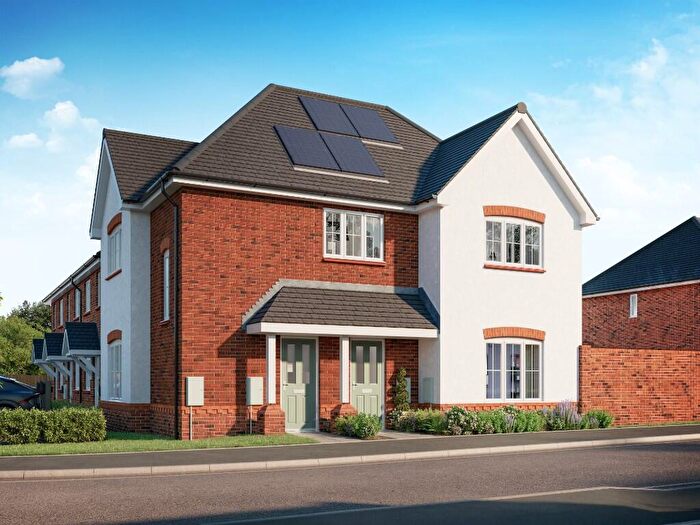
Houses for sale & to rent in Sealand, Deeside
House Prices in Sealand
Properties in Sealand have an average house price of £172,039.00 and had 64 Property Transactions within the last 3 years¹.
Sealand is an area in Deeside, Sir y Fflint - Flintshire with 1,128 households², where the most expensive property was sold for £565,000.00.
Properties for sale in Sealand
Roads and Postcodes in Sealand
Navigate through our locations to find the location of your next house in Sealand, Deeside for sale or to rent.
| Streets | Postcodes |
|---|---|
| Bartlett Close | CH5 2SS |
| Bridge View | CH5 2HY |
| Brookside | CH5 2JB CH5 2JD |
| Cedar Avenue | CH5 2RG |
| Cedar Close | CH5 2RB |
| Claremont Avenue | CH5 2SN |
| Cleveland Grove | CH5 2SW |
| Dee Road | CH5 2JJ |
| Deeside Industrial Estate | CH5 2LR |
| Deva Business Park | CH5 2HR |
| Drome Road | CH5 2NY |
| East Green | CH5 2SG |
| Evans Easyspace Industrial Park | CH5 2JZ |
| Farm Road | CH5 2HH CH5 2HJ |
| Ferry Close | CH5 2SJ |
| First Avenue | CH5 2NU |
| Fourth Avenue | CH5 2NR |
| Foxes Lane | CH5 2SH |
| Garden City Industrial Estate | CH5 2HW |
| Glan Y Fferi | CH5 2RW |
| Glenesk Court | CH5 2ST |
| Green Lane | CH5 2LH |
| Green Lane Estate | CH5 2NA CH5 2NB CH5 2ND CH5 2NE CH5 2NG CH5 2NQ |
| Green Lane West | CH5 2LJ |
| Hawthorn View | CH5 2RQ |
| Haydon Way | CH5 2SL |
| Holly Court | CH5 2JX |
| Kingsley Road | CH5 2HZ CH5 2JA |
| Manor Road | CH5 2SA CH5 2SB |
| Maple Wood Avenue | CH5 2JL |
| Meadow View | CH5 2SQ |
| Newtech Square Industrial Park | CH5 2NT |
| North Green | CH5 2SE |
| Orchard Way | CH5 2JP |
| Parkway | CH5 2NN CH5 2NS |
| Parkway Business Centre | CH5 2LD CH5 2LE |
| Parkway Industrial Park | CH5 2NL |
| Queens Road | CH5 2JN |
| Riverside Park | CH5 2JR CH5 2JT |
| Sandy Lane | CH5 2JE CH5 2JF CH5 2JG CH5 2JH CH5 2JQ |
| Sealand Avenue | CH5 2HL CH5 2HN |
| Sealand Road | CH5 2LQ CH5 2RJ CH5 2RH |
| Second Avenue | CH5 2NX |
| Second Avenue Industrial Park | CH5 2NW |
| Sixth Avenue | CH5 2LB |
| South Green | CH5 2SF |
| St Bartholomews Court | CH5 2QT |
| Stafford Road | CH5 2JW |
| Stoneleigh Close | CH5 2JS |
| Tenth Avenue | CH5 2UA |
| Tenth Avenue Industrial Park | CH5 2TW |
| Third Avenue | CH5 2LA |
| Villa Road | CH5 2RL |
| Welsh Road | CH5 2HT CH5 2HU CH5 2HX CH5 2RA CH5 2RF CH5 2JU CH5 2JY CH5 2LS CH5 2LT CH5 2LY |
| West Green | CH5 2SD |
| Weston Close | CH5 2SR |
| Whiteway Grove | CH5 2SP |
Transport near Sealand
- FAQ
- Price Paid By Year
- Property Type Price
Frequently asked questions about Sealand
What is the average price for a property for sale in Sealand?
The average price for a property for sale in Sealand is £172,039. This amount is 18% lower than the average price in Deeside. There are 713 property listings for sale in Sealand.
What streets have the most expensive properties for sale in Sealand?
The streets with the most expensive properties for sale in Sealand are St Bartholomews Court at an average of £520,000, Sealand Road at an average of £402,333 and Green Lane at an average of £350,000.
What streets have the most affordable properties for sale in Sealand?
The streets with the most affordable properties for sale in Sealand are Riverside Park at an average of £102,875, Bridge View at an average of £118,500 and Sandy Lane at an average of £131,666.
Which train stations are available in or near Sealand?
Some of the train stations available in or near Sealand are Hawarden Bridge, Shotton and Hawarden.
Property Price Paid in Sealand by Year
The average sold property price by year was:
| Year | Average Sold Price | Price Change |
Sold Properties
|
|---|---|---|---|
| 2025 | £188,809 | 16% |
21 Properties |
| 2024 | £157,900 | -7% |
20 Properties |
| 2023 | £169,021 | 3% |
23 Properties |
| 2022 | £163,250 | -1% |
24 Properties |
| 2021 | £164,118 | 12% |
35 Properties |
| 2020 | £144,112 | 5% |
20 Properties |
| 2019 | £136,867 | -43% |
34 Properties |
| 2018 | £196,359 | 31% |
32 Properties |
| 2017 | £135,899 | 5% |
38 Properties |
| 2016 | £129,775 | 7% |
29 Properties |
| 2015 | £120,349 | 16% |
32 Properties |
| 2014 | £101,591 | -11% |
34 Properties |
| 2013 | £112,989 | -1% |
29 Properties |
| 2012 | £114,567 | 14% |
14 Properties |
| 2011 | £98,996 | 1% |
14 Properties |
| 2010 | £97,971 | 9% |
21 Properties |
| 2009 | £89,541 | -25% |
12 Properties |
| 2008 | £112,139 | -17% |
14 Properties |
| 2007 | £131,612 | 5% |
56 Properties |
| 2006 | £125,078 | 1% |
50 Properties |
| 2005 | £123,340 | 13% |
27 Properties |
| 2004 | £107,350 | 34% |
25 Properties |
| 2003 | £70,635 | 12% |
74 Properties |
| 2002 | £61,861 | 23% |
78 Properties |
| 2001 | £47,329 | 6% |
18 Properties |
| 2000 | £44,720 | -1% |
31 Properties |
| 1999 | £45,265 | 6% |
13 Properties |
| 1998 | £42,541 | -11% |
17 Properties |
| 1997 | £47,432 | 9% |
19 Properties |
| 1996 | £43,158 | -3% |
26 Properties |
| 1995 | £44,442 | - |
25 Properties |
Property Price per Property Type in Sealand
Here you can find historic sold price data in order to help with your property search.
The average Property Paid Price for specific property types in the last three years are:
| Property Type | Average Sold Price | Sold Properties |
|---|---|---|
| Semi Detached House | £150,566.00 | 30 Semi Detached Houses |
| Detached House | £345,750.00 | 8 Detached Houses |
| Terraced House | £143,365.00 | 26 Terraced Houses |

