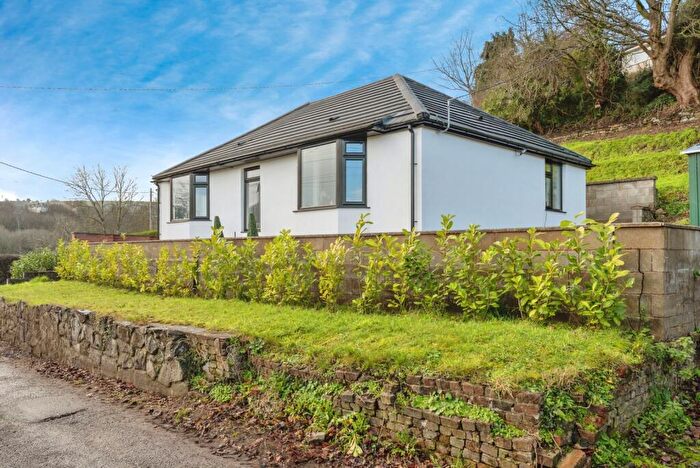
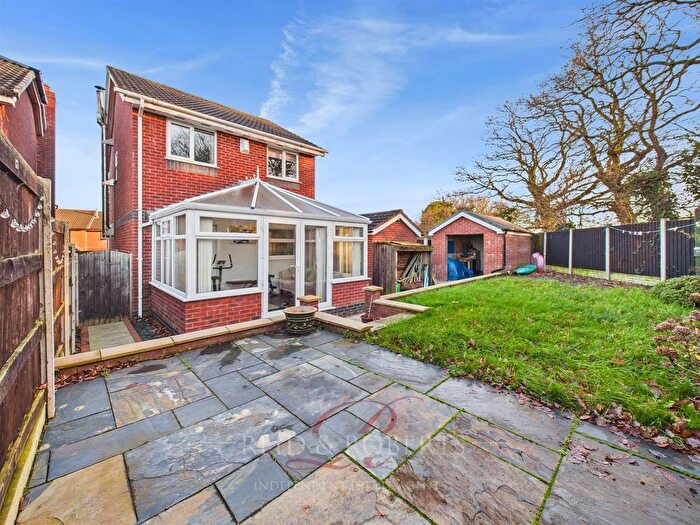
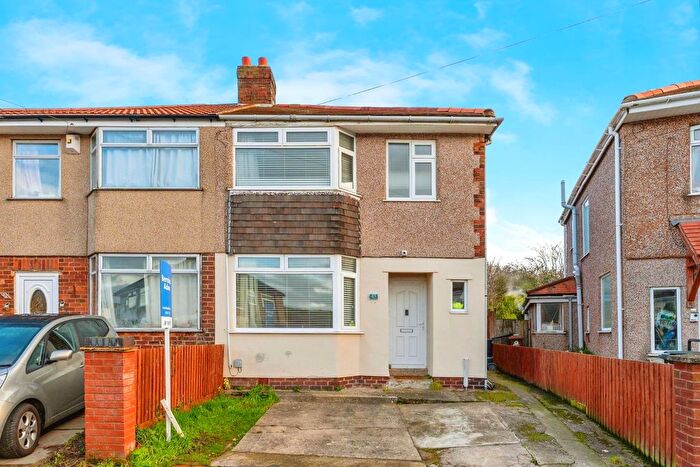
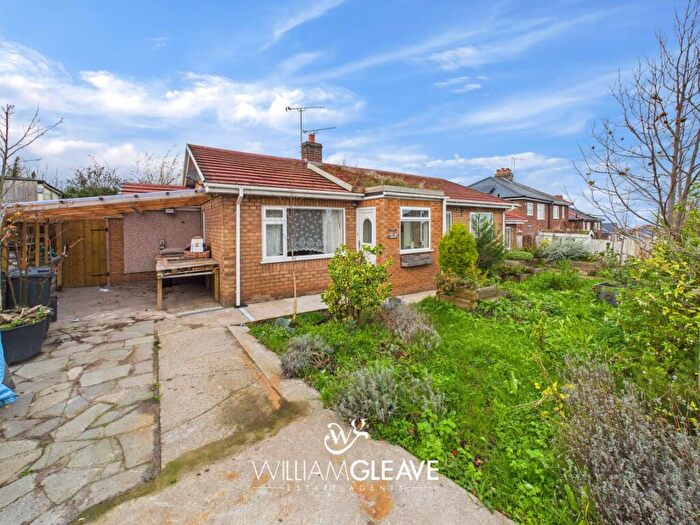
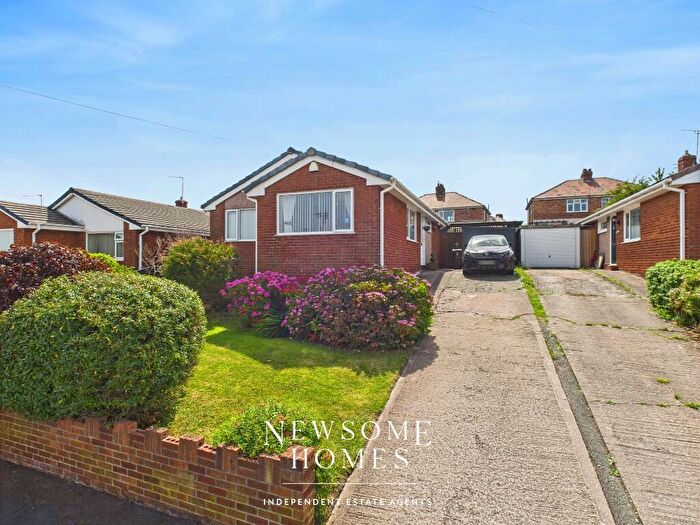
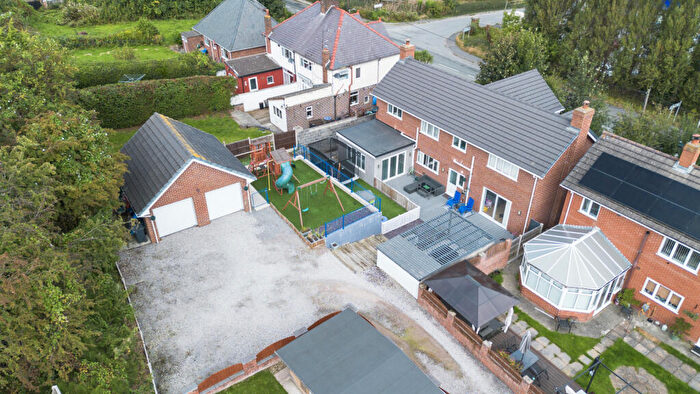
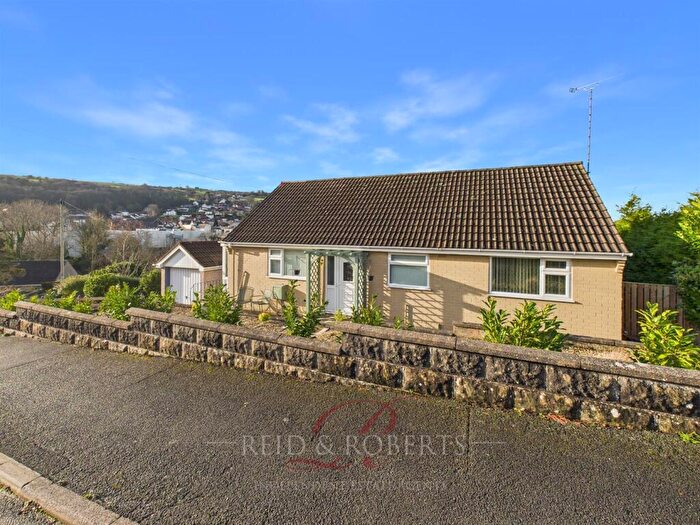
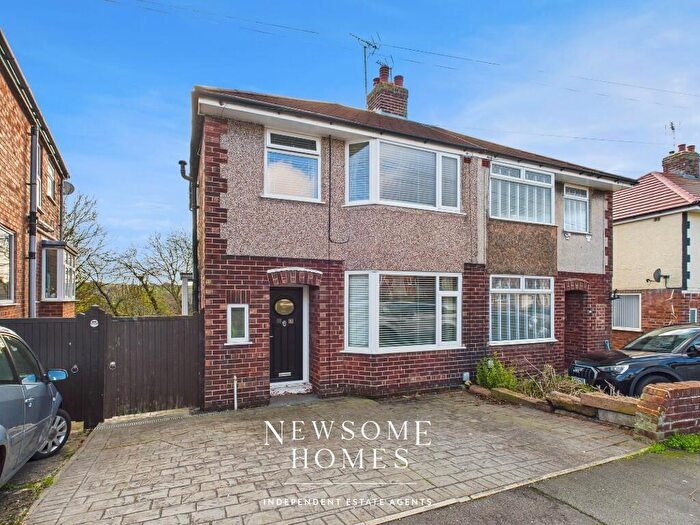
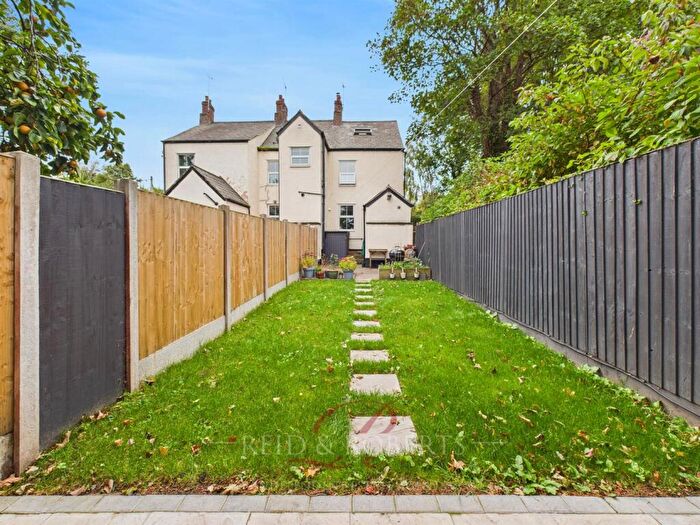
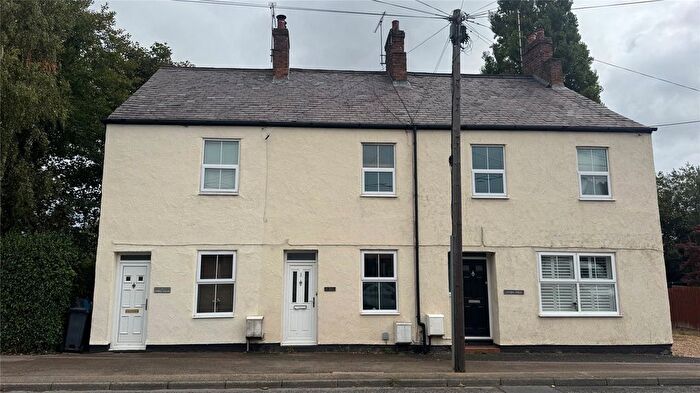
Houses for sale & to rent in Greenfield, Holywell
House Prices in Greenfield
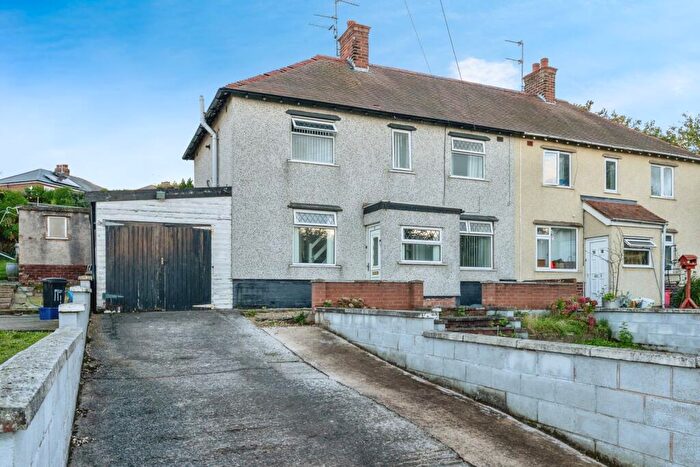
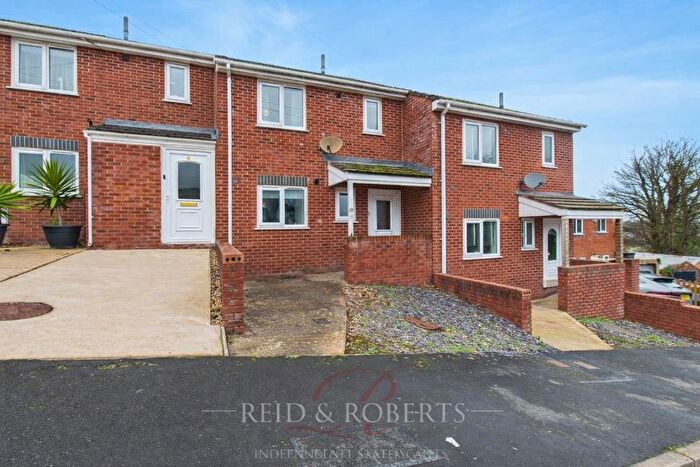
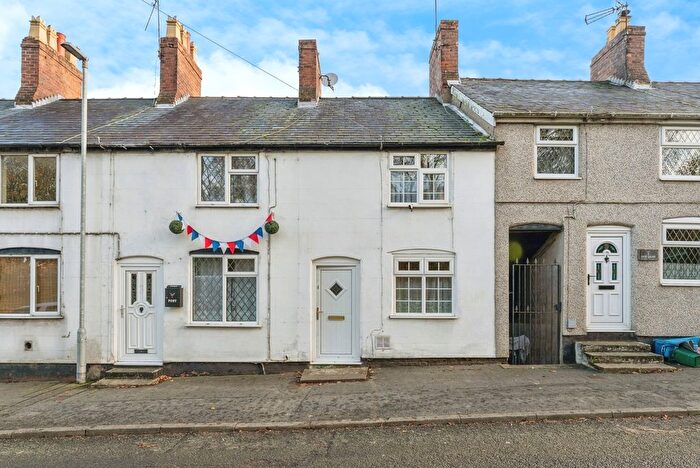
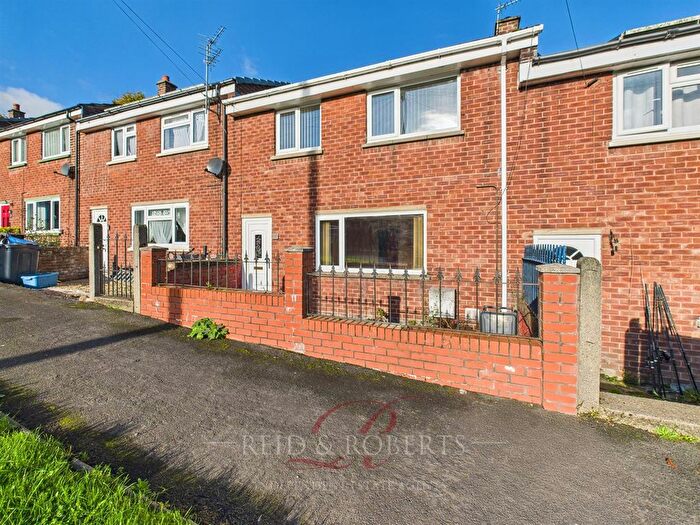
Properties in Greenfield have an average house price of £170,201.00 and had 77 Property Transactions within the last 3 years¹.
Greenfield is an area in Holywell, Sir y Fflint - Flintshire with 1,145 households², where the most expensive property was sold for £550,000.00.
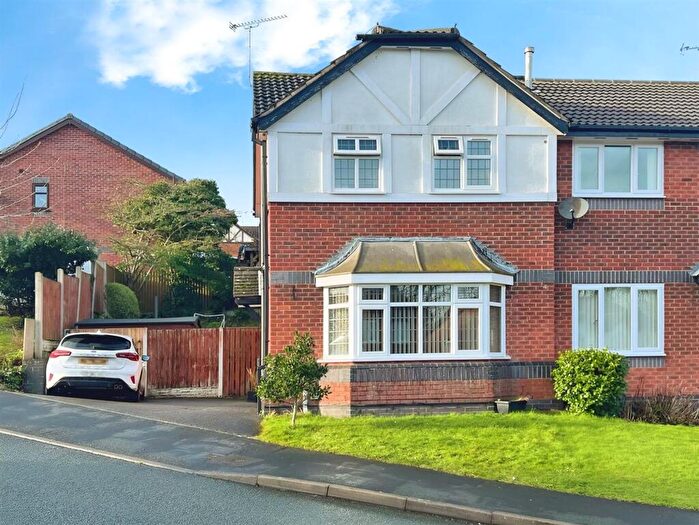
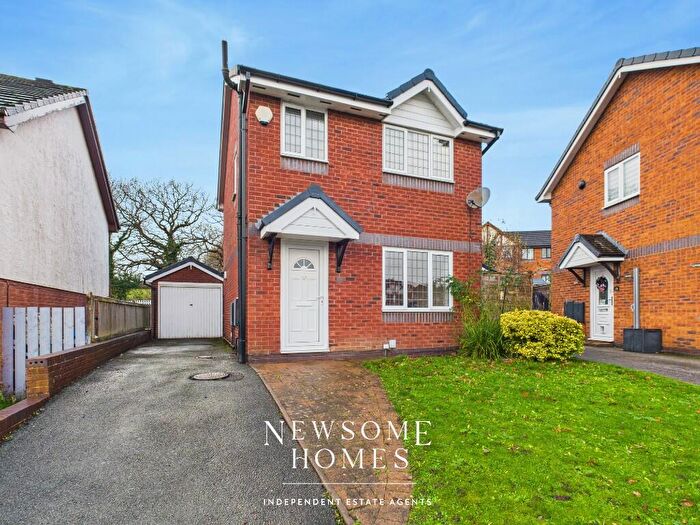
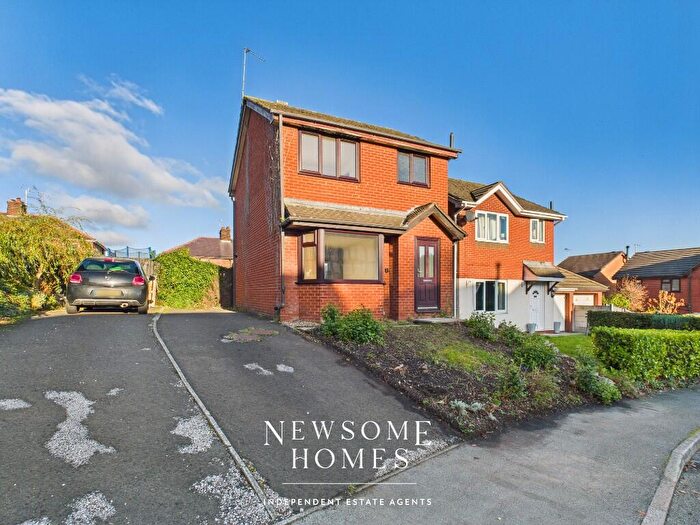
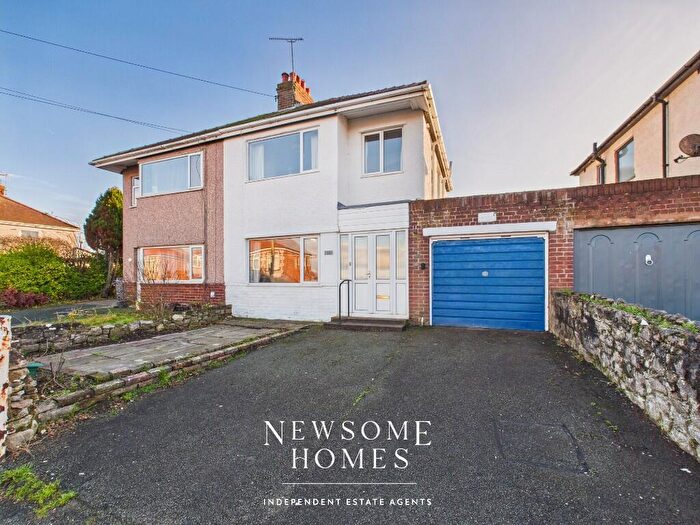
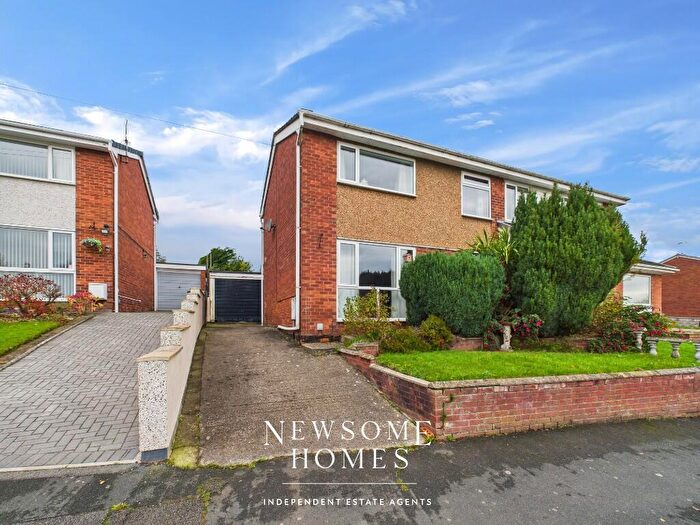
Properties for sale in Greenfield
Previously listed properties in Greenfield
Roads and Postcodes in Greenfield
Navigate through our locations to find the location of your next house in Greenfield, Holywell for sale or to rent.
| Streets | Postcodes |
|---|---|
| Abbey Court | CH8 7QX |
| Bagillt Road | CH8 7EY CH8 7EP CH8 7GJ CH8 7FF CH8 7HW |
| Bala Avenue | CH8 7HD |
| Basingwerk Avenue | CH8 7JT |
| Basingwerk Terrace | CH8 7QT |
| Bryn Afon | CH8 7PW |
| Cae Gwenith | CH8 7QQ |
| Cae Y Dderwen | CH8 7QW |
| Cairnton Crescent | CH8 7EX |
| Church Close | CH8 7XX |
| Cilgant Yr Hen Ysgol | CH8 7ER |
| Clwyd Avenue | CH8 7HE |
| Crosfield Road | CH8 7JB |
| Dee View Road | CH8 7HY |
| Delyn Road | CH8 7JD |
| Derby Terrace | CH8 7HF |
| Dock Road | CH8 7ES |
| Dyffryn Glas | CH8 7RU |
| Englefield Road | CH8 7JU |
| Ffordd Dwyfor | CH8 7PR |
| Ffordd Y Glyn | CH8 7PT |
| Fulbrooke | CH8 7JN CH8 7JW |
| Greenfield Business Centre Road | CH8 7GR |
| Greenfield Business Park 1 | CH8 7HJ |
| Greenfield Road | CH8 7PZ CH8 7QB CH8 7QH CH8 7QU CH8 7GH CH8 7NX CH8 7RF CH8 7FH |
| Groesffordd | CH8 7JJ |
| Kings Avenue | CH8 7JH |
| Kings Villas | CH8 7HS |
| Llys Y Berllan | CH8 7QZ |
| Lower Dee View Road | CH8 7QN |
| Maes Y Dyffryn | CH8 7QR |
| Meadow Villas | CH8 7QJ |
| Melin Y Dre | CH8 7XL |
| Mostyn Road | CH8 7EJ CH8 9DN |
| New Quay | CH8 7QP |
| New Shop Parade | CH8 7QS |
| Old Quay | CH8 7QL |
| Park Hall Road | CH8 7JX |
| Providence Court | CH8 7EW |
| Queens Road | CH8 7JE CH8 7JF |
| Rayon Road | CH8 7EQ CH8 7EU |
| Rhodfa Wenlo | CH8 7XW |
| School Lane | CH8 7HR CH8 7HT CH8 7GD |
| Shipping Lane | CH8 7FP |
| Spring Bank | CH8 7QE |
| St Edmunds Terrace | CH8 7PS |
| Station Road | CH8 7EL |
| Strand View | CH8 7QD |
| Sycamore Terrace | CH8 9DW |
| Sycamore Villas | CH8 7PY |
| Tan Y Bryn | CH8 7JG CH8 7JQ |
| Tan Y Felin | CH8 7PU CH8 7QA |
| The Close | CH8 7JP CH8 7JR |
| The Moor | CH8 8SW |
| Trinity Road | CH8 7JY CH8 7JZ |
| Tros Yr Aber | CH8 7XP |
| Woodland Drive | CH8 7HZ |
| CH8 7QF CH8 7QG CH8 7FG |
Transport near Greenfield
-
Flint Station
-
West Kirby Station
-
Neston Station
-
Heswall Station
-
Hoylake Station
-
Manor Road Station
-
Meols Station
-
Upton Station
-
Prestatyn Station
-
Hawarden Bridge Station
- FAQ
- Price Paid By Year
- Property Type Price
Frequently asked questions about Greenfield
What is the average price for a property for sale in Greenfield?
The average price for a property for sale in Greenfield is £170,201. This amount is 21% lower than the average price in Holywell. There are 259 property listings for sale in Greenfield.
What streets have the most expensive properties for sale in Greenfield?
The streets with the most expensive properties for sale in Greenfield are New Quay at an average of £380,000, Dyffryn Glas at an average of £299,950 and Tros Yr Aber at an average of £291,250.
What streets have the most affordable properties for sale in Greenfield?
The streets with the most affordable properties for sale in Greenfield are Bala Avenue at an average of £109,071, Dee View Road at an average of £121,500 and Fulbrooke at an average of £125,000.
Which train stations are available in or near Greenfield?
Some of the train stations available in or near Greenfield are Flint, West Kirby and Neston.
Property Price Paid in Greenfield by Year
The average sold property price by year was:
| Year | Average Sold Price | Price Change |
Sold Properties
|
|---|---|---|---|
| 2025 | £183,522 | 10% |
20 Properties |
| 2024 | £165,915 | 0,4% |
23 Properties |
| 2023 | £165,265 | 11% |
34 Properties |
| 2022 | £146,412 | 5% |
54 Properties |
| 2021 | £138,421 | 9% |
26 Properties |
| 2020 | £126,604 | 0,2% |
24 Properties |
| 2019 | £126,377 | 11% |
37 Properties |
| 2018 | £112,308 | 2% |
41 Properties |
| 2017 | £109,706 | 1% |
41 Properties |
| 2016 | £108,121 | 6% |
32 Properties |
| 2015 | £101,655 | 2% |
35 Properties |
| 2014 | £99,807 | 2% |
27 Properties |
| 2013 | £98,027 | -9% |
22 Properties |
| 2012 | £107,215 | -22% |
32 Properties |
| 2011 | £131,142 | 34% |
14 Properties |
| 2010 | £86,291 | -28% |
17 Properties |
| 2009 | £110,618 | -10% |
25 Properties |
| 2008 | £121,311 | -6% |
26 Properties |
| 2007 | £128,025 | 12% |
57 Properties |
| 2006 | £112,123 | 10% |
58 Properties |
| 2005 | £101,376 | 9% |
51 Properties |
| 2004 | £91,751 | 25% |
66 Properties |
| 2003 | £68,712 | 14% |
77 Properties |
| 2002 | £58,993 | 13% |
79 Properties |
| 2001 | £51,512 | 14% |
62 Properties |
| 2000 | £44,098 | 8% |
56 Properties |
| 1999 | £40,602 | 6% |
29 Properties |
| 1998 | £38,250 | -3% |
34 Properties |
| 1997 | £39,396 | -15% |
45 Properties |
| 1996 | £45,237 | - |
41 Properties |
| 1995 | £45,227 | - |
37 Properties |
Property Price per Property Type in Greenfield
Here you can find historic sold price data in order to help with your property search.
The average Property Paid Price for specific property types in the last three years are:
| Property Type | Average Sold Price | Sold Properties |
|---|---|---|
| Semi Detached House | £147,706.00 | 44 Semi Detached Houses |
| Detached House | £265,997.00 | 18 Detached Houses |
| Terraced House | £124,000.00 | 14 Terraced Houses |
| Flat | £82,500.00 | 1 Flat |

