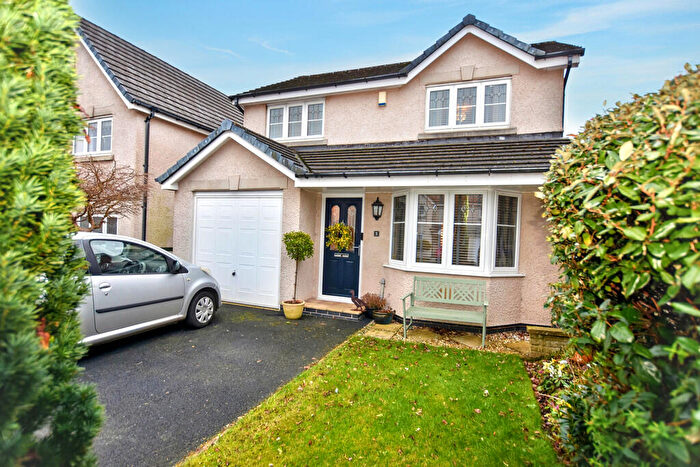
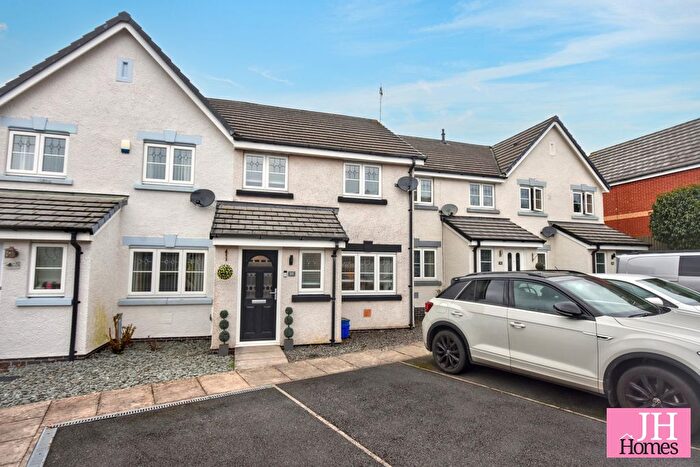
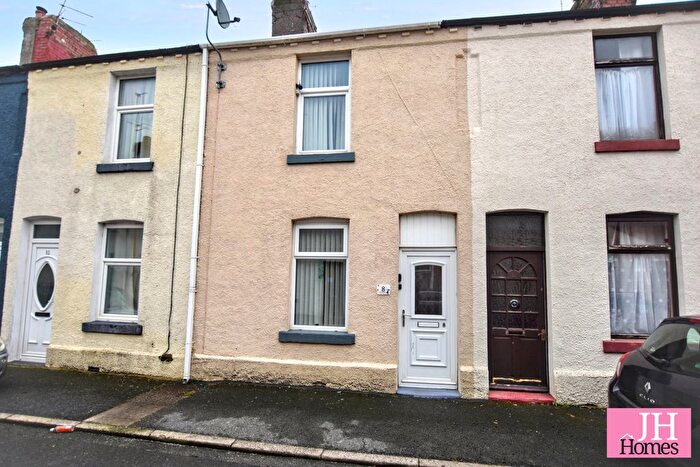
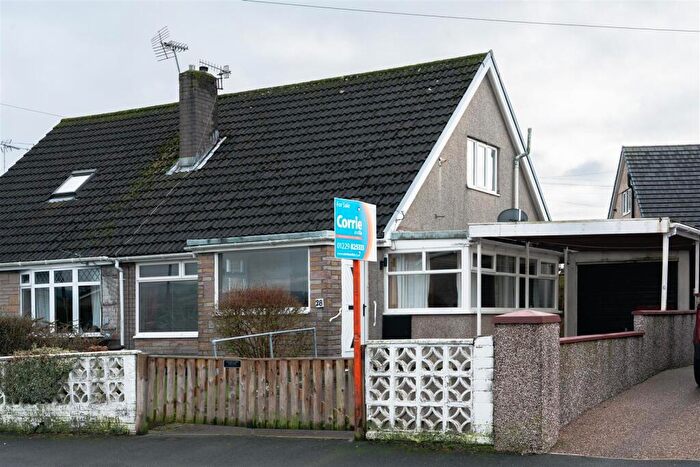
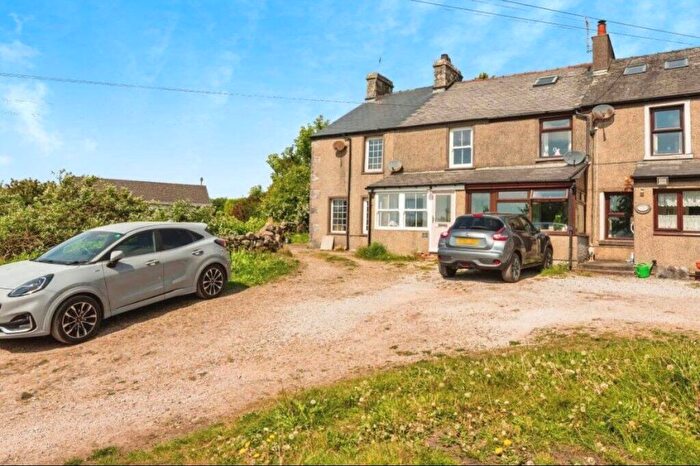
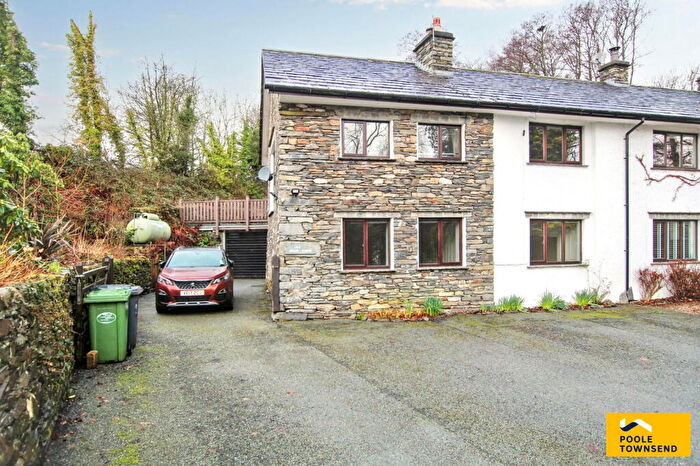
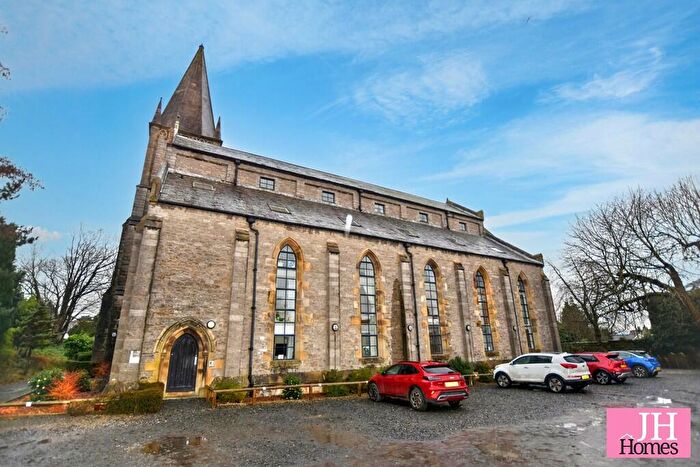
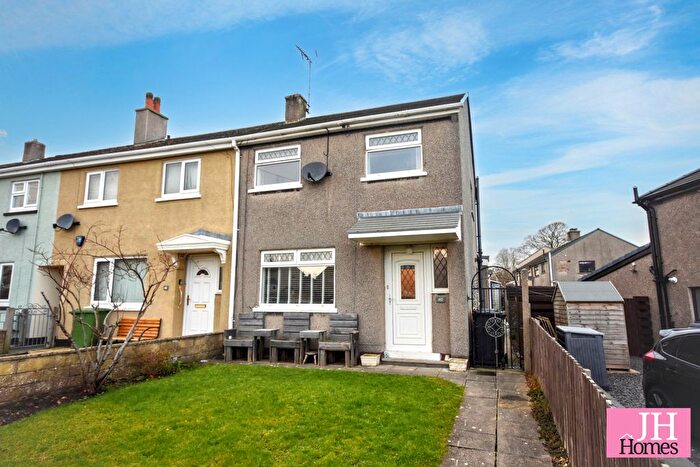
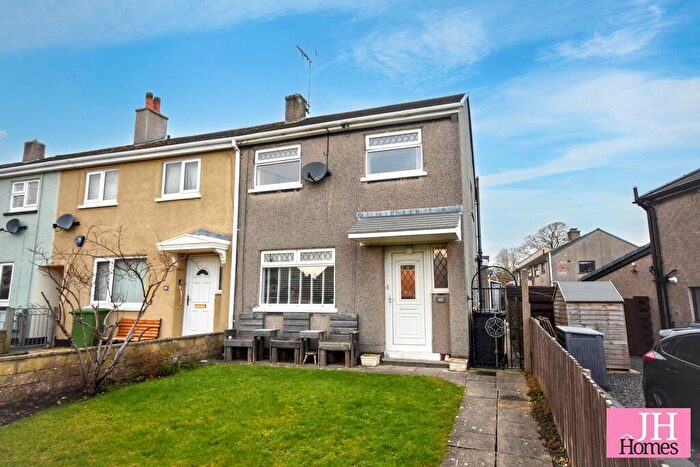
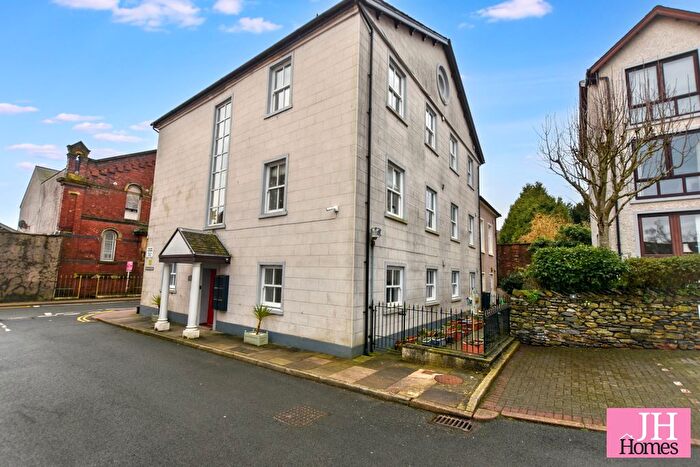
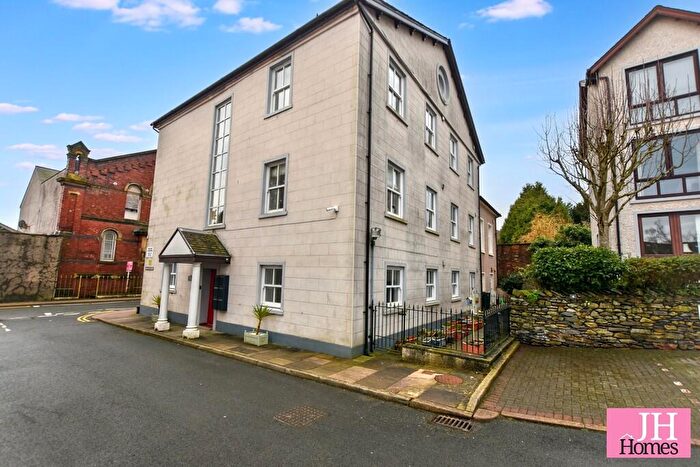
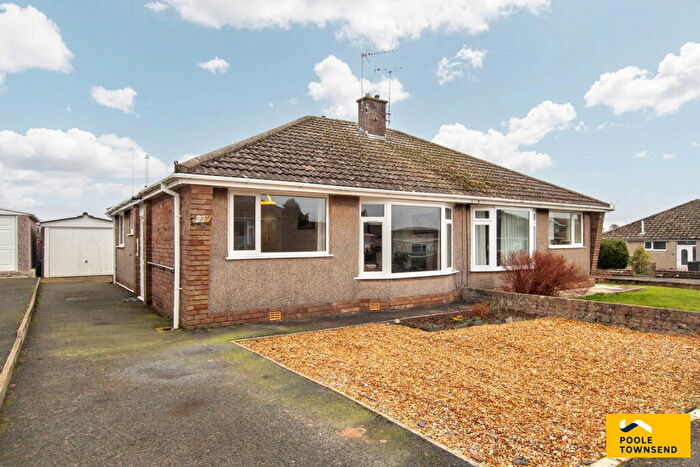
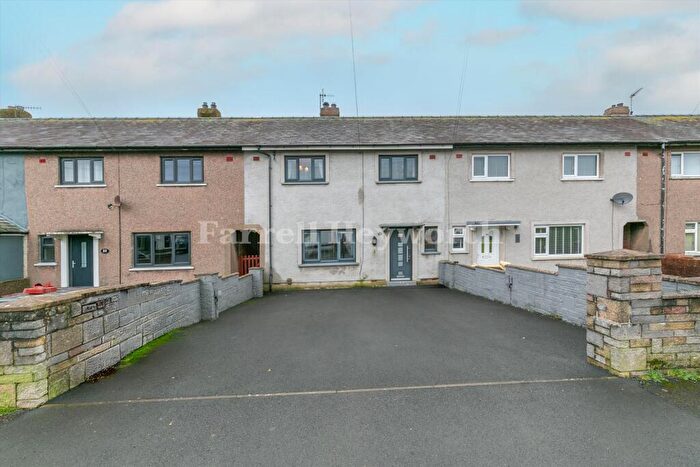
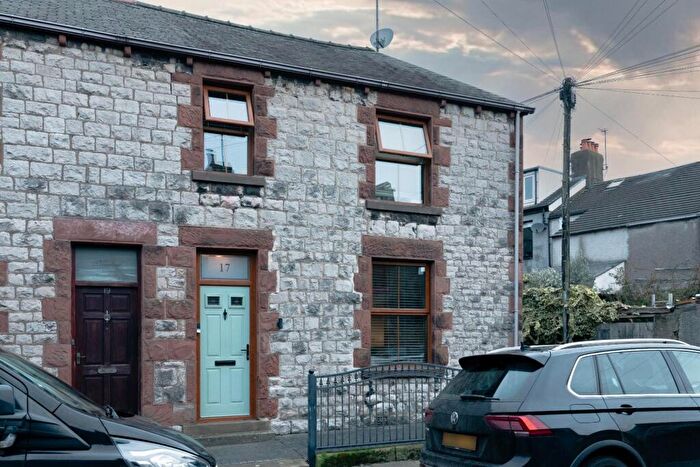
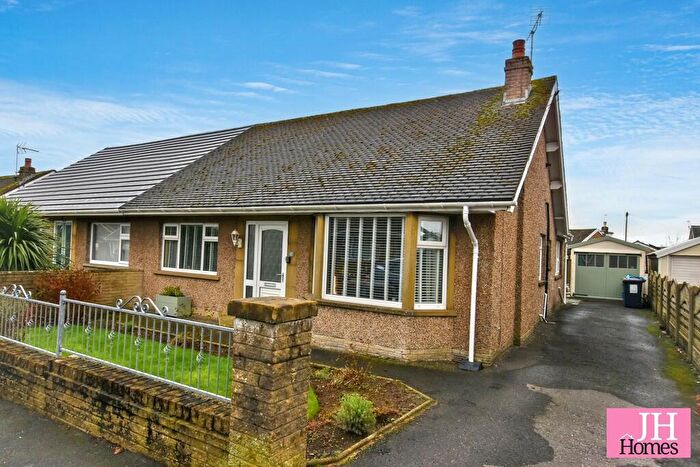
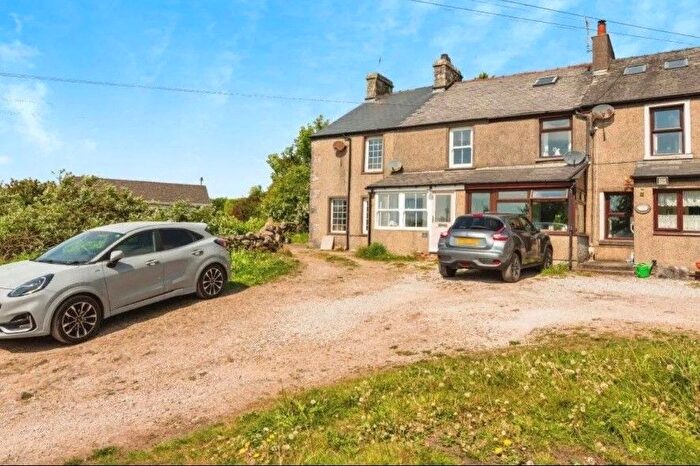
Houses for sale & to rent in Furness Peninsula, Ulverston
House Prices in Furness Peninsula
Properties in Furness Peninsula have an average house price of £346,600.00 and had 5 Property Transactions within the last 3 years¹.
Furness Peninsula is an area in Ulverston, Cumbria with 107 households², where the most expensive property was sold for £485,000.00.
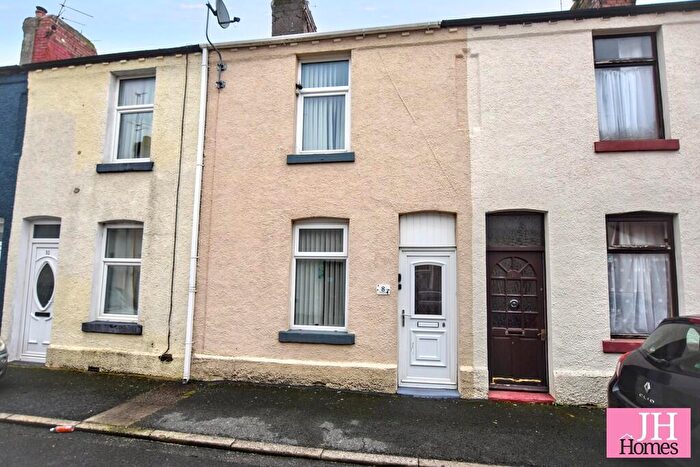
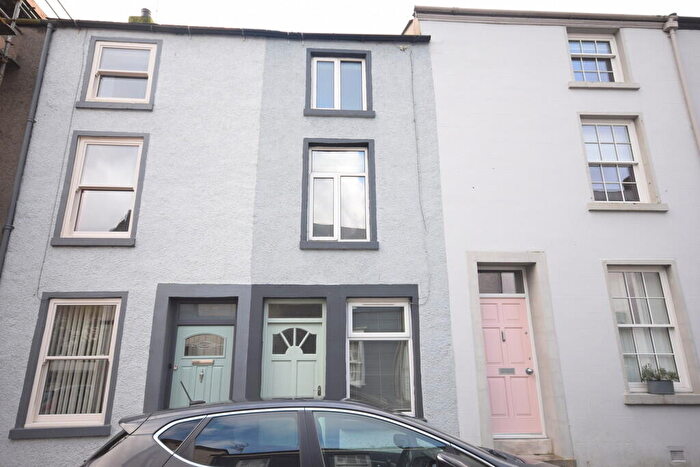
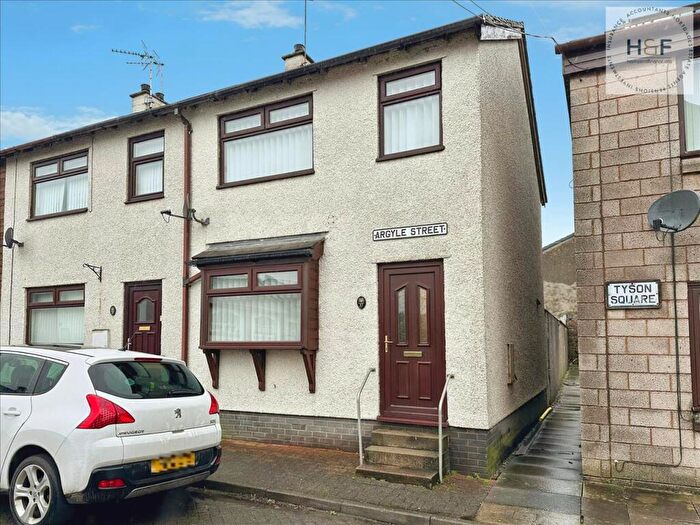
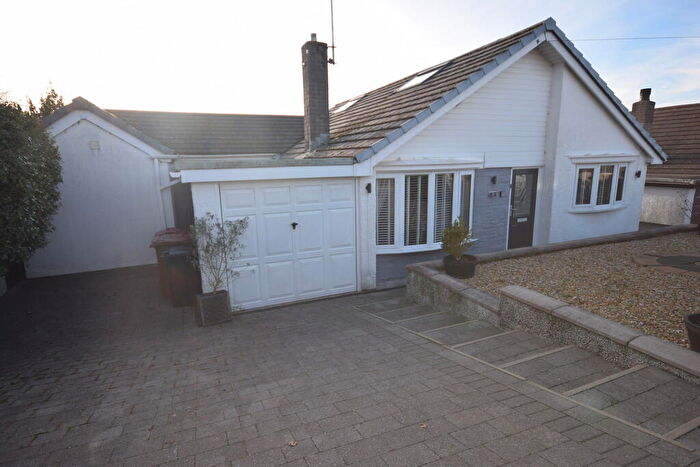
Properties for sale in Furness Peninsula
Roads and Postcodes in Furness Peninsula
Navigate through our locations to find the location of your next house in Furness Peninsula, Ulverston for sale or to rent.
| Streets | Postcodes |
|---|---|
| Ash Tree Close | LA12 0UW |
| Coast Road | LA12 9RS |
| Cooper Lane | LA12 9RA |
| Crakeside Business Park | LA12 7RT |
| Goadsbarrow | LA12 0RQ |
| Main Road | LA12 0RY |
| Moat Farm Cottages | LA12 9RU |
| Mountbarrow Road | LA12 9SE |
| Newland | LA12 7QB LA12 7QE LA12 7QF LA12 7QH LA12 7SJ |
| Old Hall Road | LA12 7PA |
| Penny Bridge | LA12 7RP LA12 7RW |
| Red Lane | LA12 9SD |
| Rose Meadows | LA12 0UX |
| Sheriff Well Close | LA12 7RU |
| Spark Bridge | LA12 7SR LA12 7SU |
| Stockbridge Lane | LA12 7NN |
| Ulverston Road | LA12 0RU |
| Weint Lane | LA12 0SR |
| LA12 0JR LA12 0PT LA12 0PX LA12 0QH LA12 0QY LA12 0RA LA12 0RB LA12 0RS LA12 0SL LA12 7NZ LA12 7PE LA12 7PF LA12 7PL LA12 7PP LA12 7PS LA12 7PY LA12 7QN LA12 7QT LA12 7RZ LA12 7SA LA12 7SB LA12 7SD LA12 7SN LA12 7SW LA12 9RD LA12 9RF LA12 9SB |
Transport near Furness Peninsula
- FAQ
- Price Paid By Year
- Property Type Price
Frequently asked questions about Furness Peninsula
What is the average price for a property for sale in Furness Peninsula?
The average price for a property for sale in Furness Peninsula is £346,600. This amount is 20% higher than the average price in Ulverston. There are 1,606 property listings for sale in Furness Peninsula.
What streets have the most expensive properties for sale in Furness Peninsula?
The streets with the most expensive properties for sale in Furness Peninsula are Ash Tree Close at an average of £455,000 and Weint Lane at an average of £380,000.
What streets have the most affordable properties for sale in Furness Peninsula?
The streets with the most affordable properties for sale in Furness Peninsula are Rose Meadows at an average of £197,000 and Coast Road at an average of £216,000.
Which train stations are available in or near Furness Peninsula?
Some of the train stations available in or near Furness Peninsula are Ulverston, Dalton and Askam.
Property Price Paid in Furness Peninsula by Year
The average sold property price by year was:
| Year | Average Sold Price | Price Change |
Sold Properties
|
|---|---|---|---|
| 2025 | £197,000 | -95% |
1 Property |
| 2024 | £384,000 | 43% |
4 Properties |
| 2022 | £220,000 | -36% |
1 Property |
| 2021 | £300,000 | -31% |
1 Property |
| 2020 | £393,333 | 35% |
3 Properties |
| 2019 | £254,366 | -60% |
6 Properties |
| 2018 | £407,737 | -16% |
7 Properties |
| 2017 | £475,000 | 69% |
1 Property |
| 2016 | £145,000 | 32% |
1 Property |
| 2014 | £99,250 | - |
2 Properties |
Property Price per Property Type in Furness Peninsula
Here you can find historic sold price data in order to help with your property search.
The average Property Paid Price for specific property types in the last three years are:
| Property Type | Average Sold Price | Sold Properties |
|---|---|---|
| Detached House | £350,333.00 | 3 Detached Houses |
| Terraced House | £485,000.00 | 1 Terraced House |
| Semi Detached House | £197,000.00 | 1 Semi Detached House |

