Houses for sale & to rent in Ulverston Town, Ulverston
House Prices in Ulverston Town
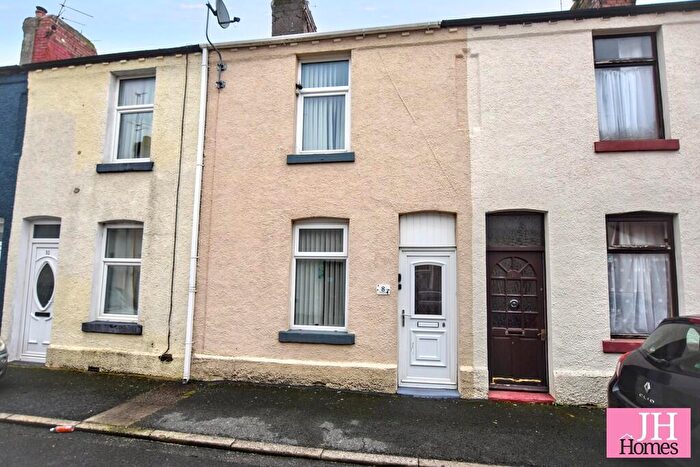
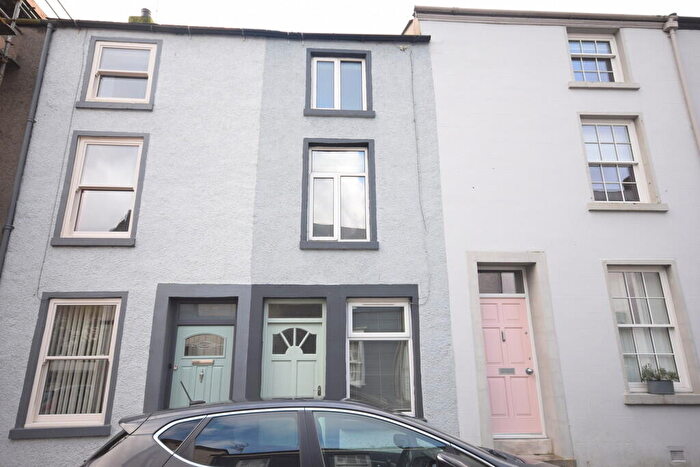
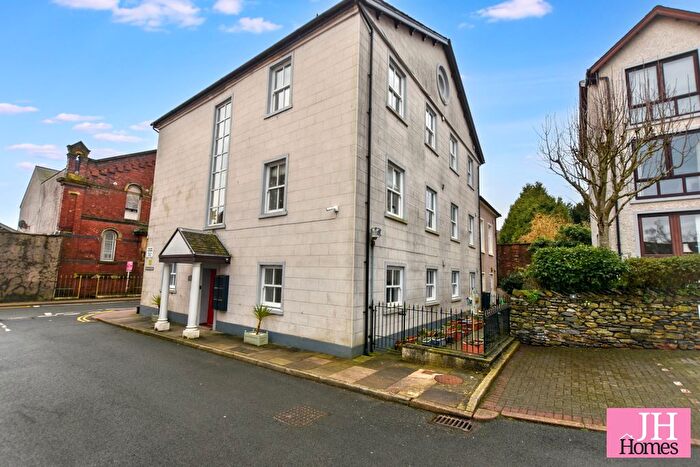
Properties in Ulverston Town have an average house price of £203,584.00 and had 109 Property Transactions within the last 3 years¹.
Ulverston Town is an area in Ulverston, Cumbria with 850 households², where the most expensive property was sold for £480,000.00.
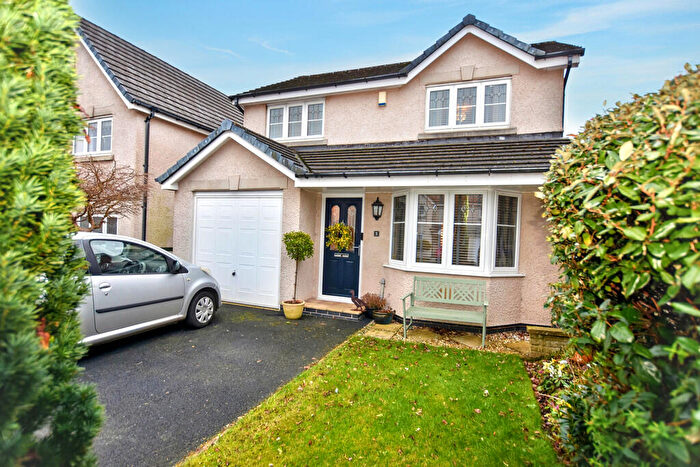
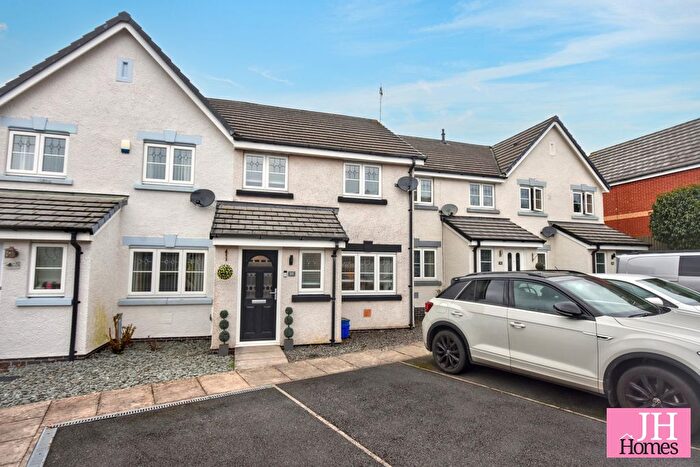
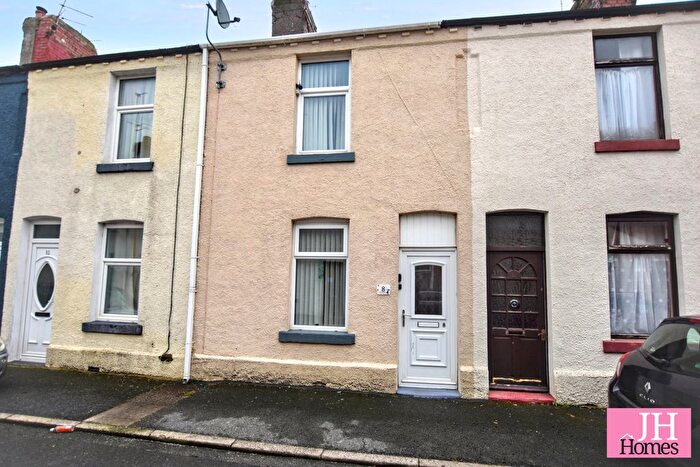
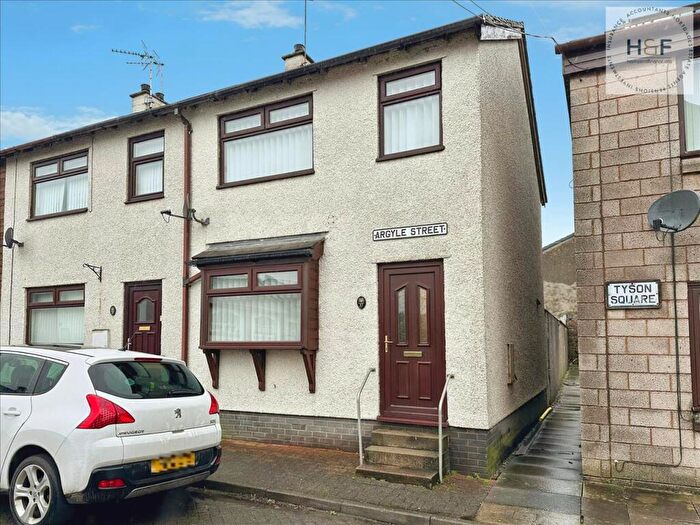
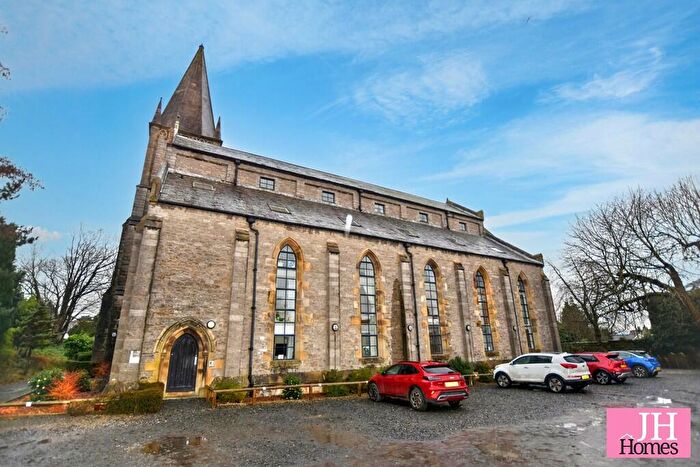
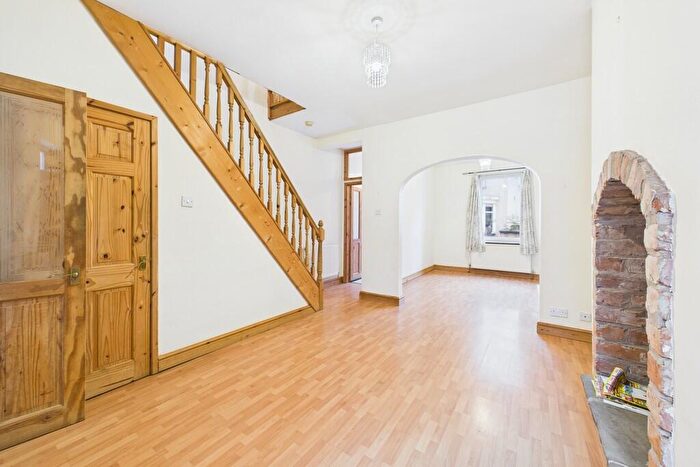
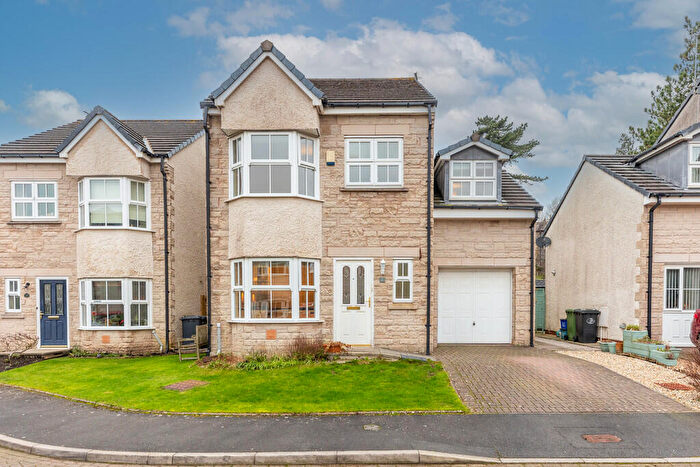
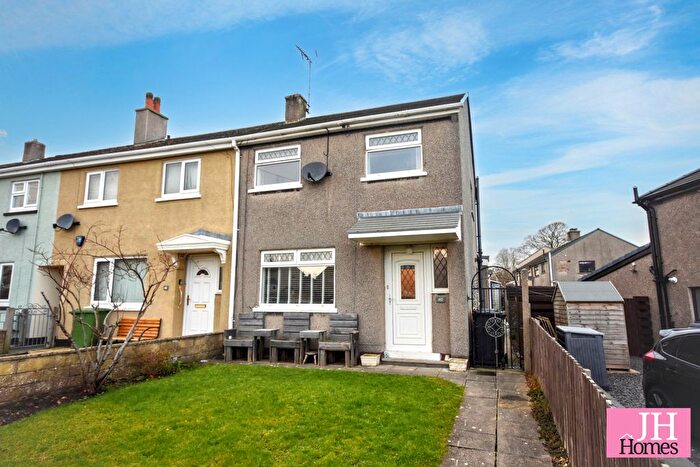
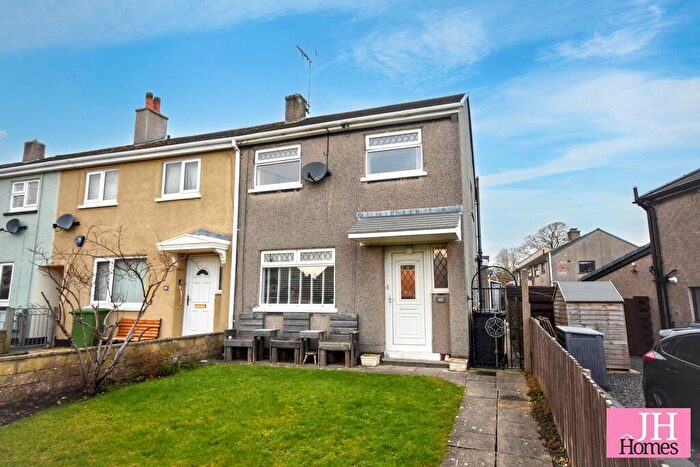
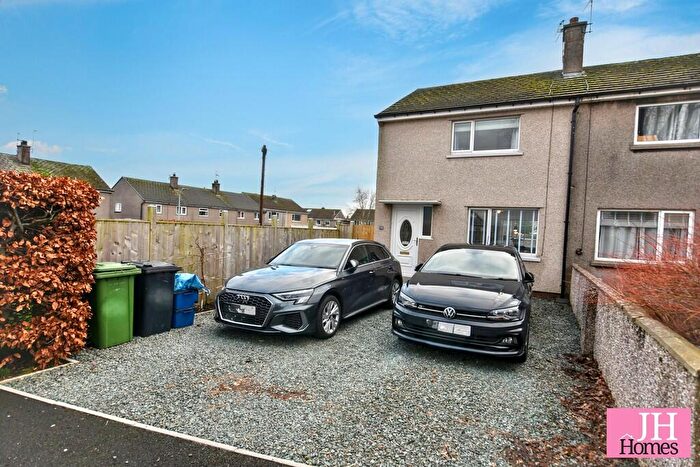
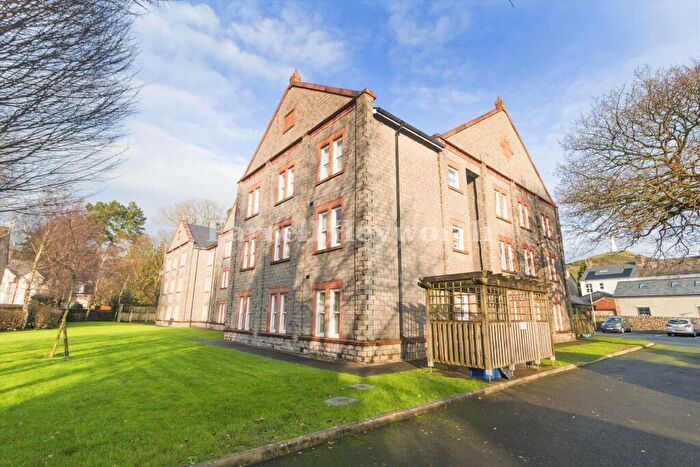
Properties for sale in Ulverston Town
Roads and Postcodes in Ulverston Town
Navigate through our locations to find the location of your next house in Ulverston Town, Ulverston for sale or to rent.
| Streets | Postcodes |
|---|---|
| Ainslie Street | LA12 7JE |
| Alexander Gardens | LA12 0DN |
| Alexander Road | LA12 0DE |
| Argyle Street | LA12 0BD |
| Back Casson Street | LA12 7JH |
| Back Hart Street | LA12 7HZ |
| Back Lane | LA12 7EJ |
| Benson Street | LA12 7AG |
| Brewery Street | LA12 7HU |
| Brogden Street | LA12 0AH LA12 0AJ LA12 0AX LA12 7AH |
| Brogden Villas | LA12 0AY |
| Burlington Mews | LA12 7TG |
| Burlington Street | LA12 7JA LA12 7UD |
| Butlers Yard | LA12 7EF |
| Casson Street | LA12 7JQ |
| Cavendish Street | LA12 7AD |
| Chapel Street | LA12 0AR LA12 0BA |
| Clarence Street | LA12 7JJ |
| Cox Street | LA12 0AS |
| Fell Street | LA12 0AD LA12 0AG |
| Fountain Street | LA12 7EA LA12 7EQ |
| Garden Lea | LA12 0BB |
| Hart Street | LA12 7JL LA12 7JT |
| Hartley Street | LA12 0AN |
| Kings Road | LA12 0BT |
| Lightburn Road | LA12 0AU LA12 0BX |
| Little Union Street | LA12 7HP |
| Lower Brook Street | LA12 7EE |
| Market Place | LA12 7BA |
| Market Street | LA12 7AY LA12 7LR LA12 7LS LA12 7LT LA12 7TQ |
| Neville Street | LA12 0BJ LA12 0BL |
| Newton Street | LA12 7JG LA12 7JS |
| Oxford Street | LA12 0AZ |
| Princes Street | LA12 7NB LA12 7NQ |
| Quines Court | LA12 7TR |
| Richmond Terrace | LA12 0BU |
| Smiths Court | LA12 7ED |
| Tarn Side | LA12 7EH |
| The Ellers | LA12 0AB LA12 0AQ |
| The Weint | LA12 7TP |
| Theatre Street | LA12 7AQ |
| Troughton Terrace | LA12 7LE |
| Tyson Square | LA12 0BG |
| Union Place | LA12 7HS |
| Union Street | LA12 7HR LA12 7HT |
| Well Street | LA12 7EG |
Transport near Ulverston Town
- FAQ
- Price Paid By Year
- Property Type Price
Frequently asked questions about Ulverston Town
What is the average price for a property for sale in Ulverston Town?
The average price for a property for sale in Ulverston Town is £203,584. This amount is 30% lower than the average price in Ulverston. There are 310 property listings for sale in Ulverston Town.
What streets have the most expensive properties for sale in Ulverston Town?
The streets with the most expensive properties for sale in Ulverston Town are Richmond Terrace at an average of £399,166, Alexander Road at an average of £355,000 and Princes Street at an average of £340,000.
What streets have the most affordable properties for sale in Ulverston Town?
The streets with the most affordable properties for sale in Ulverston Town are Neville Street at an average of £135,000, Newton Street at an average of £140,833 and Benson Street at an average of £148,000.
Which train stations are available in or near Ulverston Town?
Some of the train stations available in or near Ulverston Town are Ulverston, Dalton and Askam.
Property Price Paid in Ulverston Town by Year
The average sold property price by year was:
| Year | Average Sold Price | Price Change |
Sold Properties
|
|---|---|---|---|
| 2025 | £194,698 | -7% |
28 Properties |
| 2024 | £208,931 | 2% |
44 Properties |
| 2023 | £203,948 | -3% |
37 Properties |
| 2022 | £209,481 | 11% |
43 Properties |
| 2021 | £187,210 | 2% |
46 Properties |
| 2020 | £184,098 | 10% |
35 Properties |
| 2019 | £165,998 | -6% |
44 Properties |
| 2018 | £175,783 | 6% |
45 Properties |
| 2017 | £164,838 | 3% |
48 Properties |
| 2016 | £159,693 | 6% |
45 Properties |
| 2015 | £150,824 | 11% |
53 Properties |
| 2014 | £133,581 | -10% |
27 Properties |
| 2013 | £146,378 | 5% |
42 Properties |
| 2012 | £139,712 | -10% |
44 Properties |
| 2011 | £153,368 | 10% |
30 Properties |
| 2010 | £138,750 | 4% |
30 Properties |
| 2009 | £133,207 | -19% |
41 Properties |
| 2008 | £158,901 | 4% |
36 Properties |
| 2007 | £152,030 | 10% |
69 Properties |
| 2006 | £137,354 | 10% |
55 Properties |
| 2005 | £122,977 | 9% |
65 Properties |
| 2004 | £111,683 | 16% |
56 Properties |
| 2003 | £93,573 | 17% |
75 Properties |
| 2002 | £77,859 | 22% |
55 Properties |
| 2001 | £60,570 | 9% |
55 Properties |
| 2000 | £55,355 | 9% |
59 Properties |
| 1999 | £50,553 | -3% |
64 Properties |
| 1998 | £51,834 | 21% |
56 Properties |
| 1997 | £41,187 | 5% |
56 Properties |
| 1996 | £38,946 | -9% |
52 Properties |
| 1995 | £42,492 | - |
35 Properties |
Property Price per Property Type in Ulverston Town
Here you can find historic sold price data in order to help with your property search.
The average Property Paid Price for specific property types in the last three years are:
| Property Type | Average Sold Price | Sold Properties |
|---|---|---|
| Terraced House | £205,761.00 | 79 Terraced Houses |
| Semi Detached House | £244,125.00 | 8 Semi Detached Houses |
| Flat | £148,026.00 | 19 Flats |
| Detached House | £390,000.00 | 3 Detached Houses |

