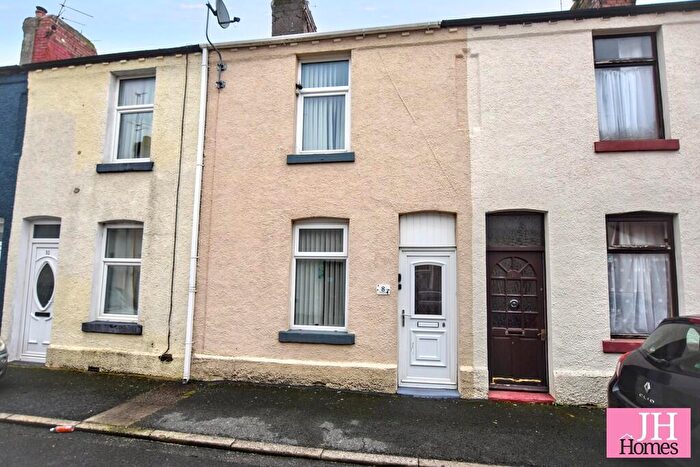
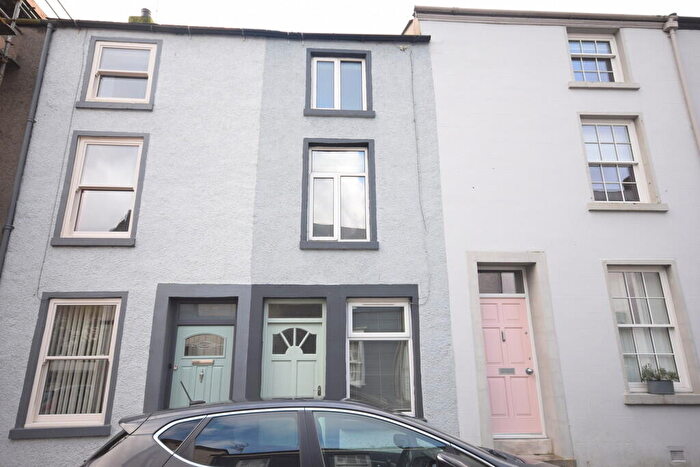
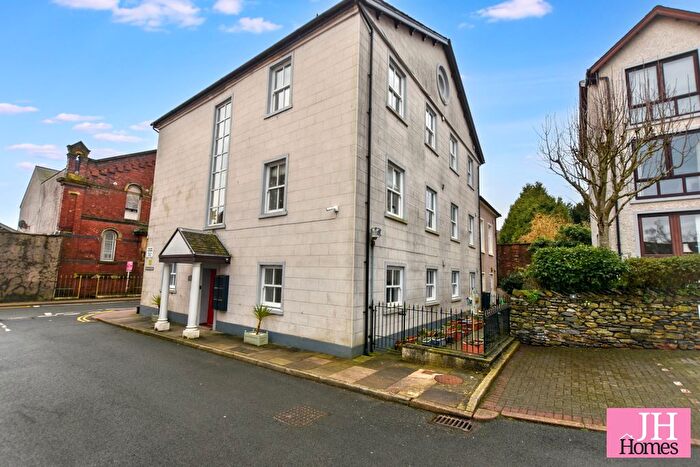
Houses for sale & to rent in Ulverston East, Ulverston
House Prices in Ulverston East
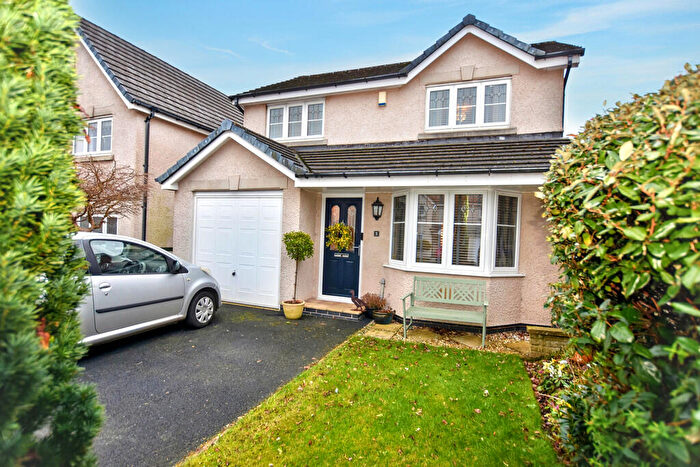
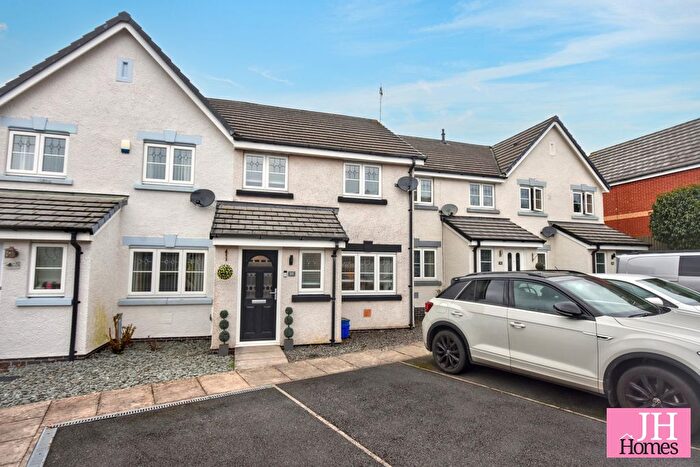
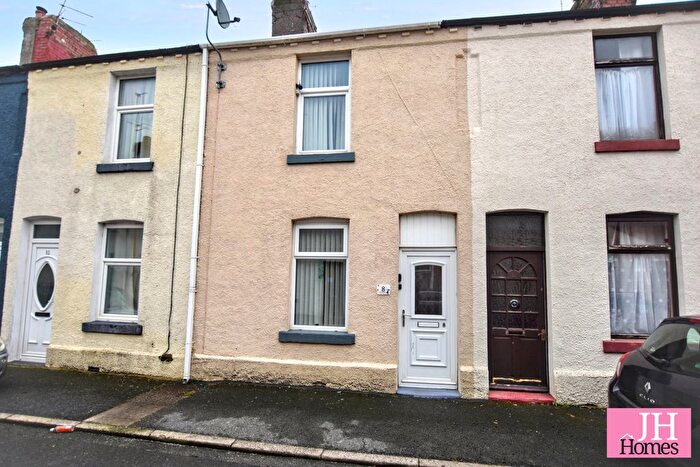
Properties in Ulverston East have an average house price of £217,475.00 and had 98 Property Transactions within the last 3 years¹.
Ulverston East is an area in Ulverston, Cumbria with 1,174 households², where the most expensive property was sold for £530,000.00.
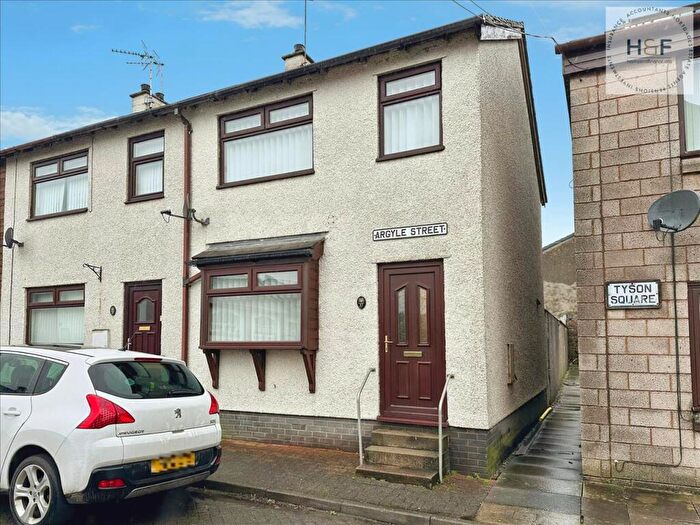
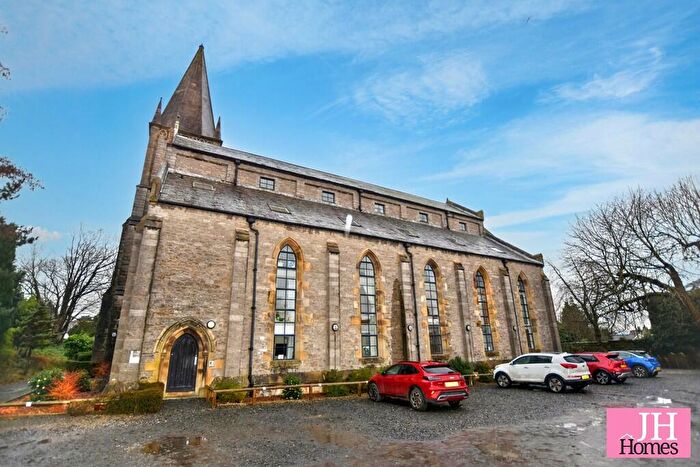
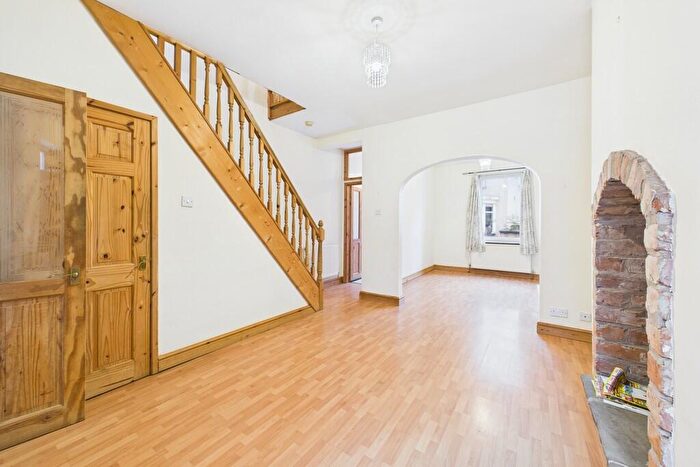
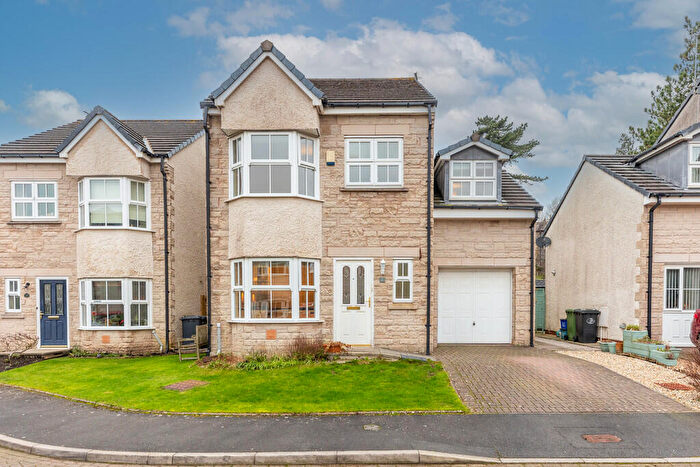
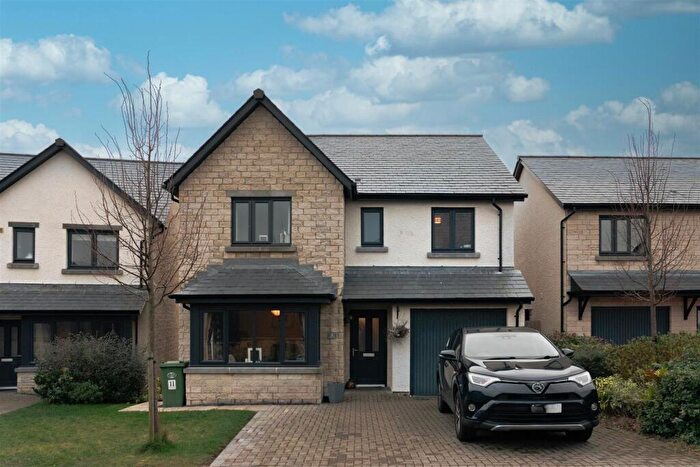
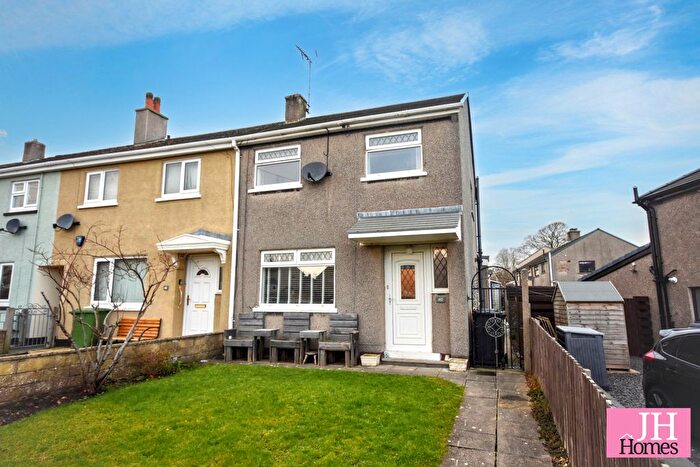
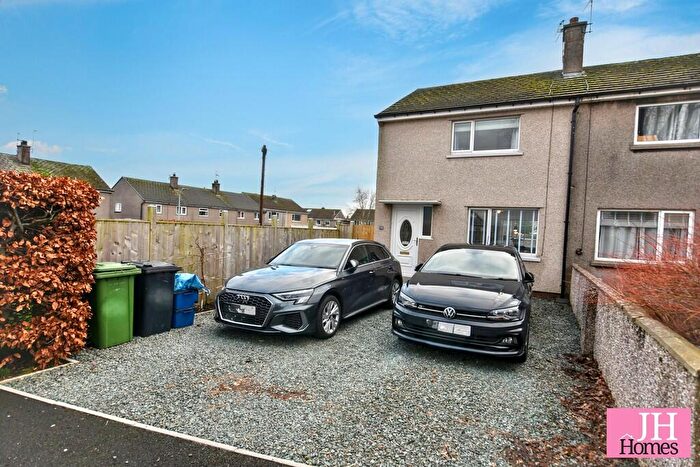
Properties for sale in Ulverston East
Roads and Postcodes in Ulverston East
Navigate through our locations to find the location of your next house in Ulverston East, Ulverston for sale or to rent.
| Streets | Postcodes |
|---|---|
| Back Brogden Street | LA12 7TL |
| Bailey Street | LA12 9AY |
| Benson Street | LA12 7AU |
| Bolton Place | LA12 7FE |
| Brewery Mount | LA12 7JD |
| Brick Kiln Road | LA12 9GP |
| Brogden Street | LA12 0DB LA12 0UU |
| Byron Street | LA12 9AS |
| Canal Side | LA12 9ER |
| Chapel Street | LA12 0AW |
| Colthouse Lane | LA12 0BE |
| County Square | LA12 7AA LA12 7AB LA12 7AL LA12 7LZ |
| Cross Lane | LA12 9DQ LA12 9BW |
| Cross Street | LA12 7LF |
| Dale Street | LA12 9AR LA12 9BA |
| Derwent Place | LA12 9BX |
| Devon Terrace | LA12 9BB |
| Devonshire Road | LA12 9AE LA12 9AJ LA12 9AL |
| Edmondson Street | LA12 9AW |
| Ellerside | LA12 0TP |
| Fell Close | LA12 0AE |
| Gloucester Square | LA12 9AH |
| Grasmere Road | LA12 9BY LA12 9BZ |
| Hart Street | LA12 7JF |
| Helm Grove | LA12 9SX |
| Hill Fall | LA12 0BQ |
| Holyoake Terrace | LA12 9DD |
| Kennedy Street | LA12 9EA |
| Kent Square | LA12 9AG |
| King Street | LA12 7DY |
| Kingsway | LA12 9AX |
| Lancaster Square | LA12 9AF |
| Lightburn Road | LA12 0EL |
| Low Lund Mews | LA12 9FB |
| Low Mill Business Park | LA12 9EE |
| Lower Brook Street | LA12 7FG LA12 7FH |
| Lund Road | LA12 9BG |
| Lund Terrace | LA12 9BD LA12 9BE |
| Market Place | LA12 7DX |
| Monument Way | LA12 9SY |
| Morecambe Road | LA12 0BH LA12 9BL LA12 9BN |
| Neville Terrace | LA12 0BP |
| New Market Street | LA12 7LJ LA12 7LN LA12 7LQ |
| Newland | LA12 7SQ |
| North Lonsdale Road | LA12 9DH LA12 9DT LA12 9DX LA12 9DZ LA12 0DW LA12 9DJ LA12 9DL LA12 9DP LA12 9DR LA12 9EB LA12 9EW |
| North Lonsdale Terrace | LA12 9AU |
| Oubas Hill | LA12 7LB LA12 7LY |
| Oxenholme Cottages | LA12 9QB |
| Priory Road | LA12 9HT LA12 9HU LA12 9QF LA12 9QQ |
| Quay Street | LA12 9AT |
| Quebec Street | LA12 9AB LA12 9AD |
| Queen Street | LA12 7AR |
| Queens Court | LA12 7FN |
| Rachaels Court | LA12 0AF |
| Rake Lane | LA12 9NQ |
| Rydal Road | LA12 9BT LA12 9BU LA12 9DA |
| Sandhall | LA12 9EQ |
| Sandhall Cottages | LA12 9EH |
| Sandside | LA12 9EG |
| Sandside Road | LA12 9EF |
| School Mews | LA12 9FE |
| Sir John Barrow Way | LA12 9SZ |
| Springfield Road | LA12 0DS LA12 0DZ LA12 0EB |
| Steel Street | LA12 9DU LA12 9DY |
| Swan Street | LA12 7JX |
| Tebay Lane | LA12 7SG |
| The Ellers | LA12 0AA LA12 9AA |
| The Old Bakery | LA12 7FB |
| Tower Street | LA12 9AN |
| Ullswater Close | LA12 9DE |
| Victoria Road | LA12 0BY LA12 0DG |
| Watery Lane | LA12 9DB LA12 9DF LA12 9DG |
| Well Lane | LA12 9BP LA12 9BS |
| West End Lane | LA12 9EP LA12 9HP LA12 9HW |
| William Street | LA12 9AP LA12 9AZ |
| York Square | LA12 9AQ |
| LA12 7QW LA12 9DS LA12 9ED LA12 9EL LA12 9EN LA12 2AJ LA12 2AR LA12 2AS LA12 7LW LA12 7QR |
Transport near Ulverston East
- FAQ
- Price Paid By Year
- Property Type Price
Frequently asked questions about Ulverston East
What is the average price for a property for sale in Ulverston East?
The average price for a property for sale in Ulverston East is £217,475. This amount is 25% lower than the average price in Ulverston. There are 527 property listings for sale in Ulverston East.
What streets have the most expensive properties for sale in Ulverston East?
The streets with the most expensive properties for sale in Ulverston East are Quay Street at an average of £400,000, Colthouse Lane at an average of £380,000 and Sir John Barrow Way at an average of £335,896.
What streets have the most affordable properties for sale in Ulverston East?
The streets with the most affordable properties for sale in Ulverston East are Cross Lane at an average of £91,168, Bailey Street at an average of £92,500 and Tower Street at an average of £117,500.
Which train stations are available in or near Ulverston East?
Some of the train stations available in or near Ulverston East are Ulverston, Cark and Cartmel and Dalton.
Property Price Paid in Ulverston East by Year
The average sold property price by year was:
| Year | Average Sold Price | Price Change |
Sold Properties
|
|---|---|---|---|
| 2025 | £227,332 | 6% |
32 Properties |
| 2024 | £214,719 | 2% |
27 Properties |
| 2023 | £211,295 | 11% |
39 Properties |
| 2022 | £188,259 | 0,5% |
43 Properties |
| 2021 | £187,408 | -12% |
61 Properties |
| 2020 | £209,241 | 20% |
66 Properties |
| 2019 | £167,805 | 11% |
31 Properties |
| 2018 | £150,079 | -8% |
53 Properties |
| 2017 | £162,181 | 10% |
42 Properties |
| 2016 | £145,272 | 7% |
35 Properties |
| 2015 | £135,138 | -7% |
43 Properties |
| 2014 | £144,342 | -2% |
40 Properties |
| 2013 | £147,192 | 12% |
30 Properties |
| 2012 | £129,737 | -14% |
33 Properties |
| 2011 | £147,418 | -6% |
38 Properties |
| 2010 | £155,940 | 17% |
25 Properties |
| 2009 | £128,666 | -7% |
27 Properties |
| 2008 | £138,134 | -9% |
34 Properties |
| 2007 | £150,056 | 3% |
72 Properties |
| 2006 | £144,974 | 11% |
91 Properties |
| 2005 | £128,748 | 32% |
75 Properties |
| 2004 | £87,011 | 11% |
38 Properties |
| 2003 | £77,145 | 27% |
57 Properties |
| 2002 | £56,220 | 10% |
46 Properties |
| 2001 | £50,867 | 18% |
38 Properties |
| 2000 | £41,721 | 17% |
44 Properties |
| 1999 | £34,612 | -7% |
43 Properties |
| 1998 | £36,862 | 6% |
35 Properties |
| 1997 | £34,525 | 2% |
40 Properties |
| 1996 | £33,666 | 1% |
21 Properties |
| 1995 | £33,168 | - |
25 Properties |
Property Price per Property Type in Ulverston East
Here you can find historic sold price data in order to help with your property search.
The average Property Paid Price for specific property types in the last three years are:
| Property Type | Average Sold Price | Sold Properties |
|---|---|---|
| Semi Detached House | £242,546.00 | 19 Semi Detached Houses |
| Detached House | £390,058.00 | 17 Detached Houses |
| Terraced House | £159,871.00 | 57 Terraced Houses |
| Flat | £192,100.00 | 5 Flats |

