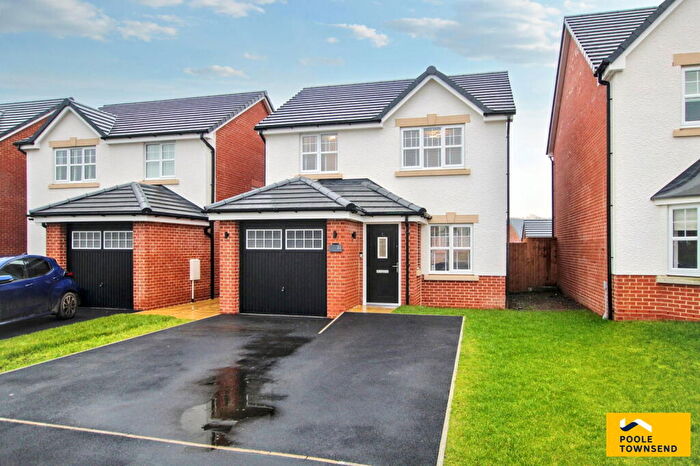
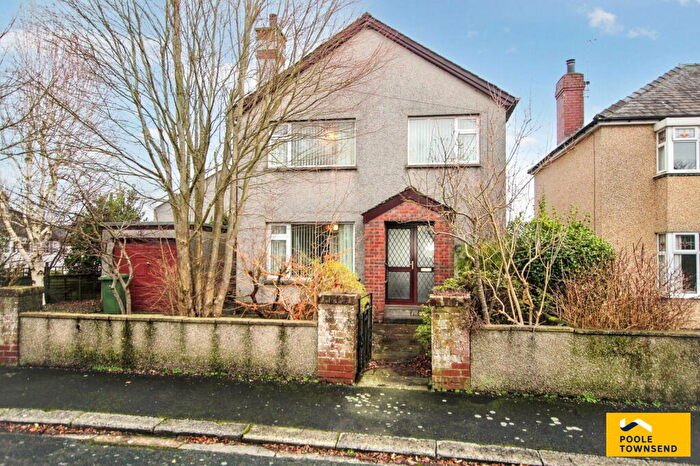
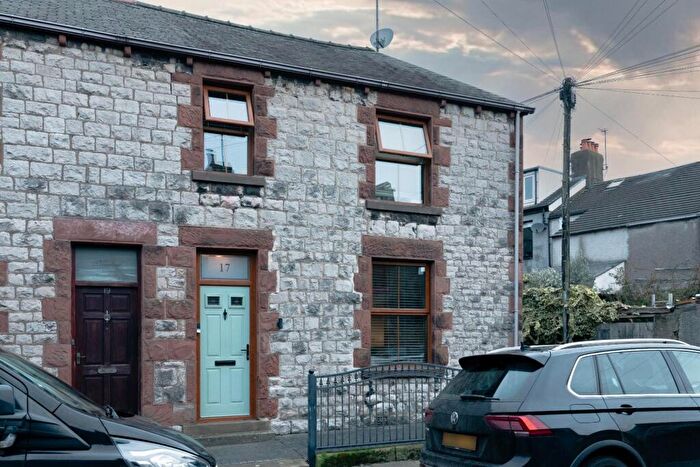
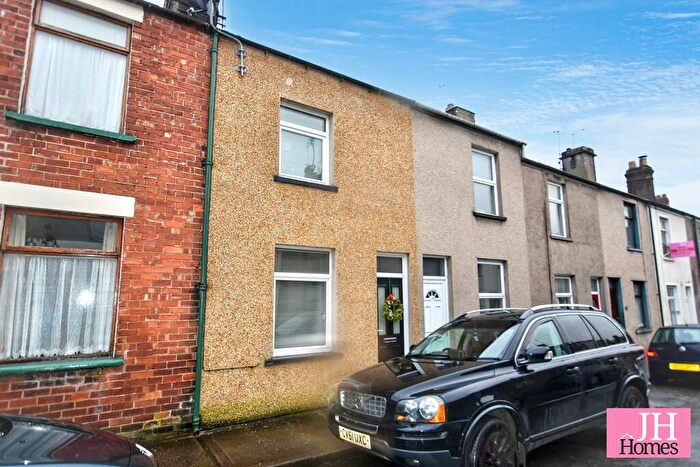
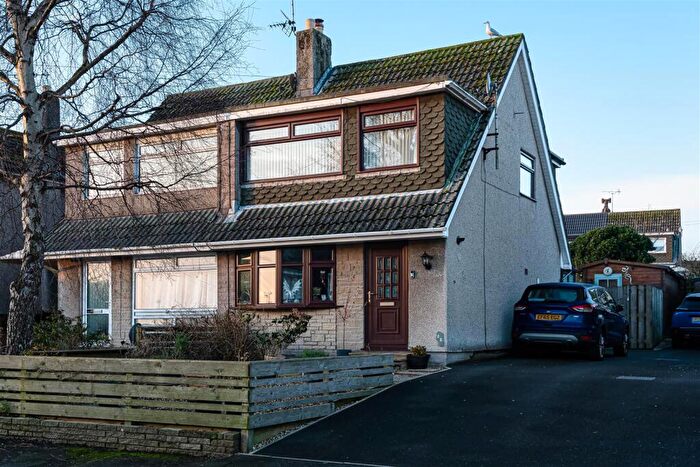
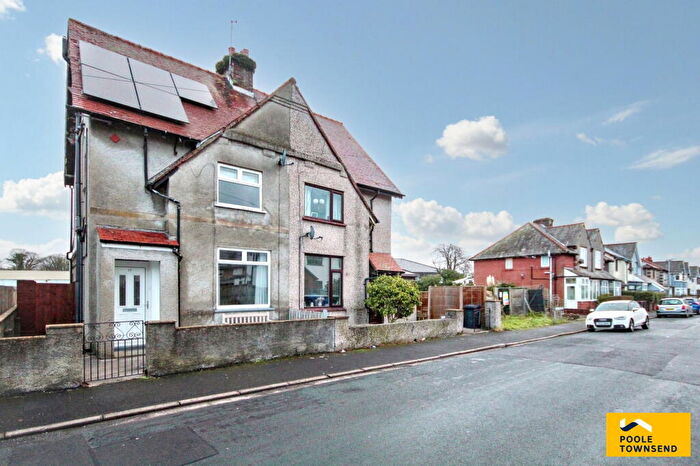
Houses for sale & to rent in Ulverston South, Ulverston
House Prices in Ulverston South
Properties in Ulverston South have an average house price of £241,781.00 and had 64 Property Transactions within the last 3 years¹.
Ulverston South is an area in Ulverston, Cumbria with 773 households², where the most expensive property was sold for £445,000.00.
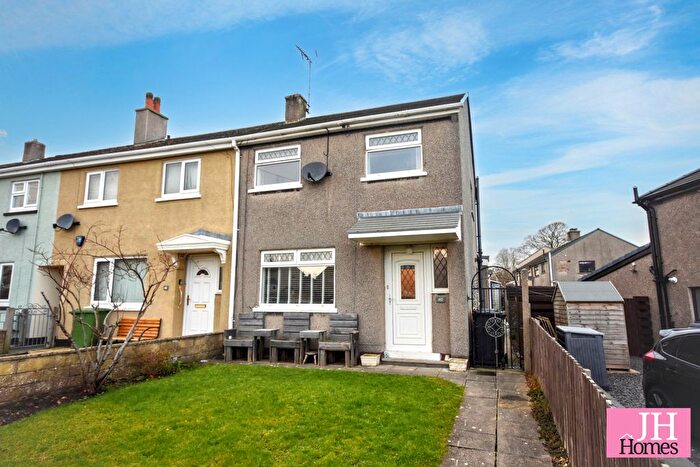
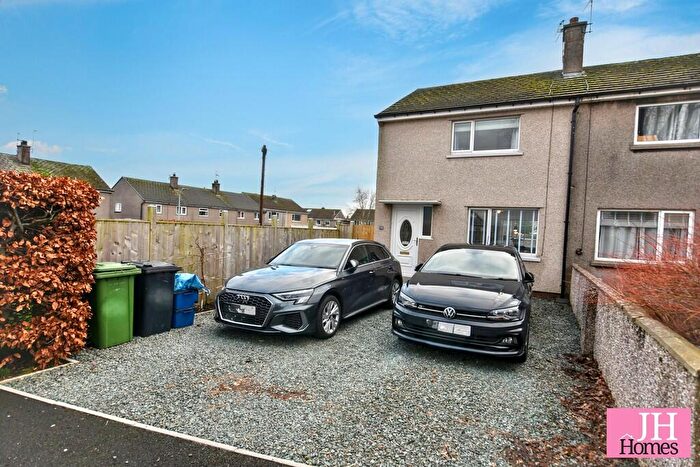
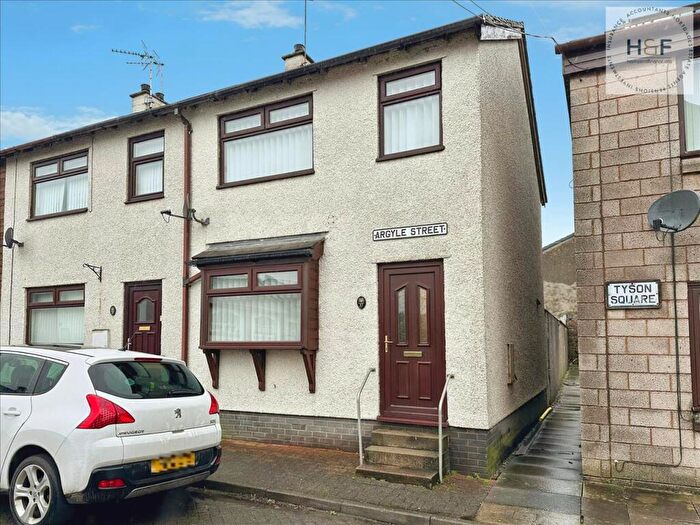
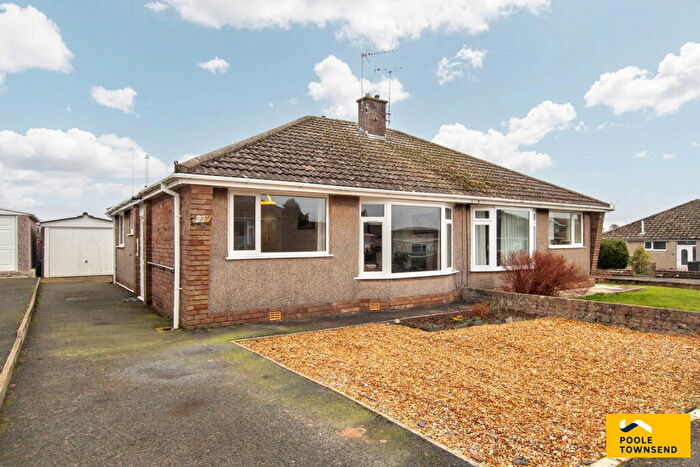
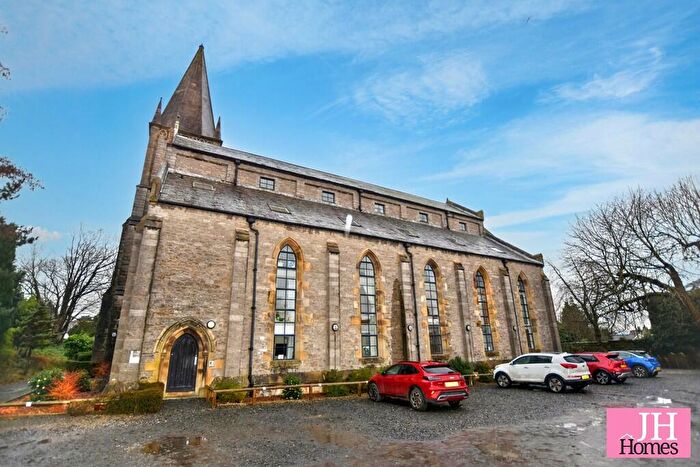
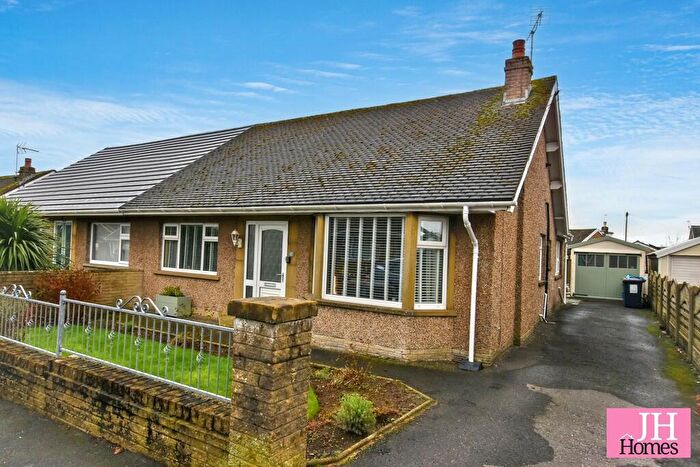
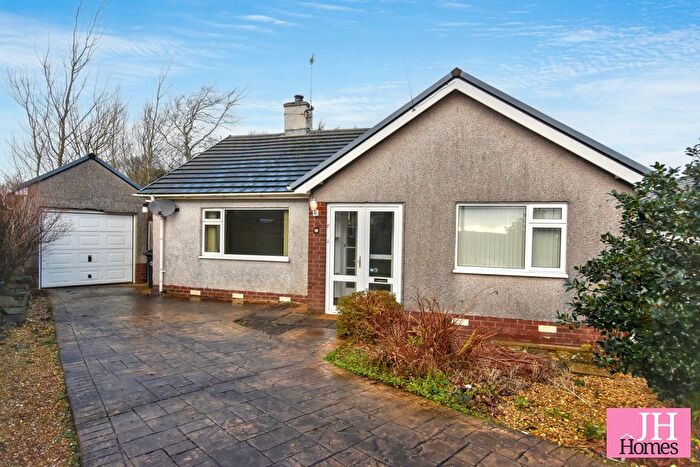
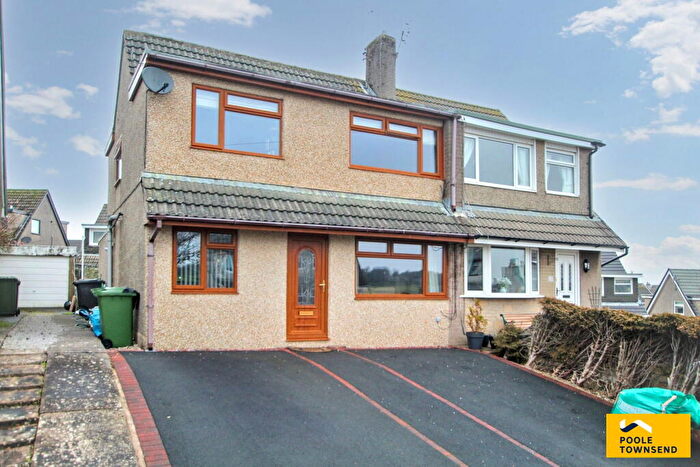
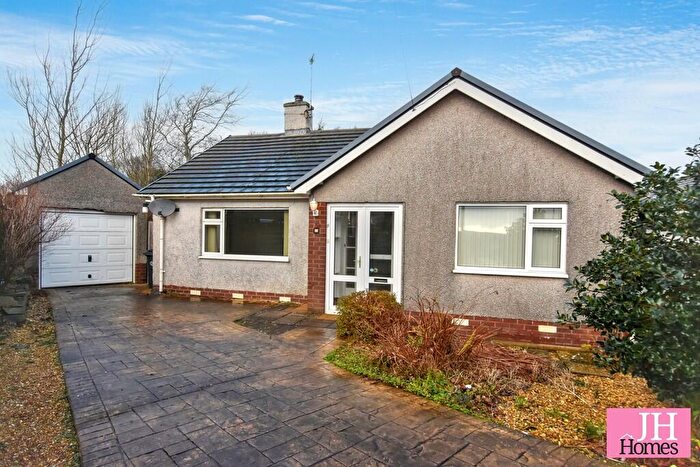
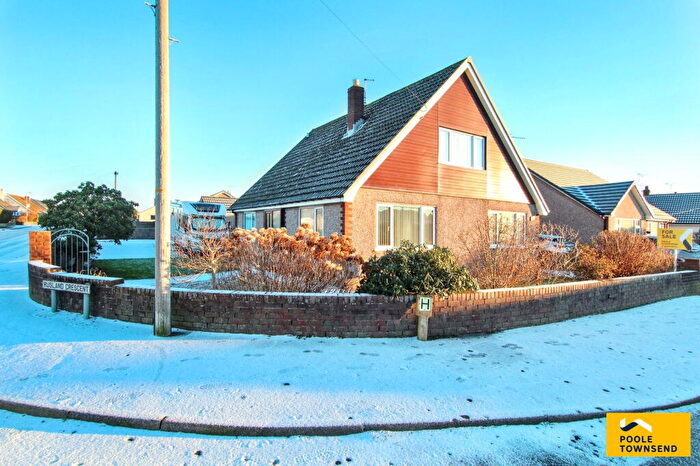
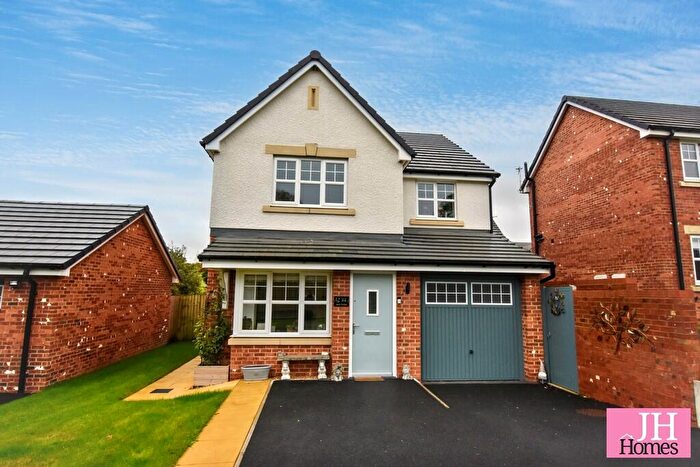
Properties for sale in Ulverston South
Roads and Postcodes in Ulverston South
Navigate through our locations to find the location of your next house in Ulverston South, Ulverston for sale or to rent.
| Streets | Postcodes |
|---|---|
| Almond Road | LA12 9JQ |
| Appletree Road | LA12 9JR |
| Bigland Drive | LA12 9NU LA12 9PD LA12 9PY |
| Birchwood Close | LA12 9PA |
| Birchwood Drive | LA12 9JL LA12 9NY LA12 9NZ LA12 9PL LA12 9PN LA12 9PS |
| Birkrigg Crescent | LA12 9NA |
| Boarbank Road | LA12 9PG |
| Campfield Road | LA12 9PB |
| Cartmel Drive | LA12 9PF LA12 9PU |
| Eden Mount | LA12 9PT |
| Hampsfell Road | LA12 9PX |
| Hazeltree Road | LA12 9JP |
| Hest View Road | LA12 9PH LA12 9PJ |
| Mearness Drive | LA12 9PE |
| Mount Barrow Way | LA12 9NT |
| Mountbarrow Road | LA12 9NJ LA12 9NL LA12 9NN LA12 9NS LA12 9SA |
| Oakwood Crest | LA12 9JT |
| Oakwood Drive | LA12 9JU LA12 9JW |
| Parkhead Road | LA12 9NX |
| Priory Road | LA12 9QE |
| Sands Close | LA12 9PP |
| Sands Road | LA12 9PR LA12 9PW |
| Stonydale | LA12 9PQ |
| Westhills Drive | LA12 9NW |
| Windsor Crescent | LA12 9NP |
| Yewbarrow Road | LA12 9JS |
Transport near Ulverston South
- FAQ
- Price Paid By Year
- Property Type Price
Frequently asked questions about Ulverston South
What is the average price for a property for sale in Ulverston South?
The average price for a property for sale in Ulverston South is £241,781. This amount is 16% lower than the average price in Ulverston. There are 318 property listings for sale in Ulverston South.
What streets have the most expensive properties for sale in Ulverston South?
The streets with the most expensive properties for sale in Ulverston South are Mount Barrow Way at an average of £445,000, Campfield Road at an average of £330,000 and Windsor Crescent at an average of £321,000.
What streets have the most affordable properties for sale in Ulverston South?
The streets with the most affordable properties for sale in Ulverston South are Appletree Road at an average of £185,000, Hazeltree Road at an average of £187,000 and Sands Road at an average of £201,666.
Which train stations are available in or near Ulverston South?
Some of the train stations available in or near Ulverston South are Ulverston, Dalton and Askam.
Property Price Paid in Ulverston South by Year
The average sold property price by year was:
| Year | Average Sold Price | Price Change |
Sold Properties
|
|---|---|---|---|
| 2025 | £257,461 | 7% |
26 Properties |
| 2024 | £239,833 | 10% |
24 Properties |
| 2023 | £216,000 | -12% |
14 Properties |
| 2022 | £242,969 | 2% |
21 Properties |
| 2021 | £237,691 | 17% |
41 Properties |
| 2020 | £196,353 | 2% |
31 Properties |
| 2019 | £191,839 | 2% |
19 Properties |
| 2018 | £188,517 | 3% |
23 Properties |
| 2017 | £182,111 | -7% |
21 Properties |
| 2016 | £194,635 | 10% |
24 Properties |
| 2015 | £174,885 | 5% |
40 Properties |
| 2014 | £165,280 | 7% |
33 Properties |
| 2013 | £154,428 | -3% |
28 Properties |
| 2012 | £158,516 | 4% |
27 Properties |
| 2011 | £151,488 | -9% |
17 Properties |
| 2010 | £164,737 | 13% |
31 Properties |
| 2009 | £142,625 | -17% |
12 Properties |
| 2008 | £167,052 | 4% |
18 Properties |
| 2007 | £160,967 | 6% |
34 Properties |
| 2006 | £151,506 | 3% |
42 Properties |
| 2005 | £146,785 | 11% |
35 Properties |
| 2004 | £130,538 | 28% |
35 Properties |
| 2003 | £94,547 | 7% |
34 Properties |
| 2002 | £87,626 | 15% |
42 Properties |
| 2001 | £74,817 | 14% |
48 Properties |
| 2000 | £64,675 | 9% |
30 Properties |
| 1999 | £59,170 | 12% |
36 Properties |
| 1998 | £52,042 | 3% |
48 Properties |
| 1997 | £50,246 | -3% |
30 Properties |
| 1996 | £51,642 | -3% |
38 Properties |
| 1995 | £52,966 | - |
24 Properties |
Property Price per Property Type in Ulverston South
Here you can find historic sold price data in order to help with your property search.
The average Property Paid Price for specific property types in the last three years are:
| Property Type | Average Sold Price | Sold Properties |
|---|---|---|
| Semi Detached House | £236,836.00 | 52 Semi Detached Houses |
| Detached House | £280,061.00 | 8 Detached Houses |
| Terraced House | £229,500.00 | 4 Terraced Houses |

