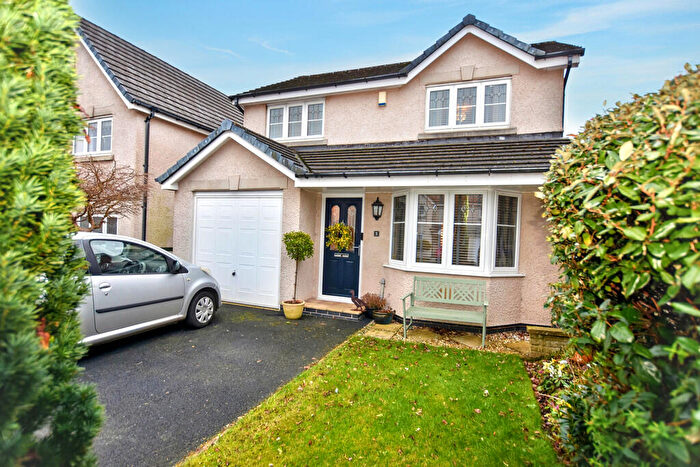
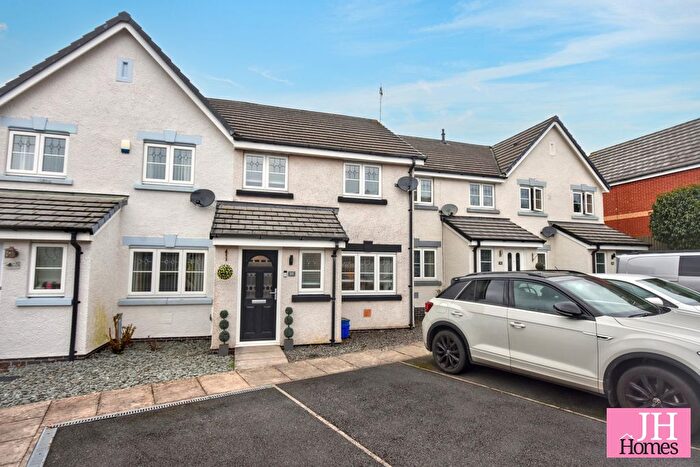
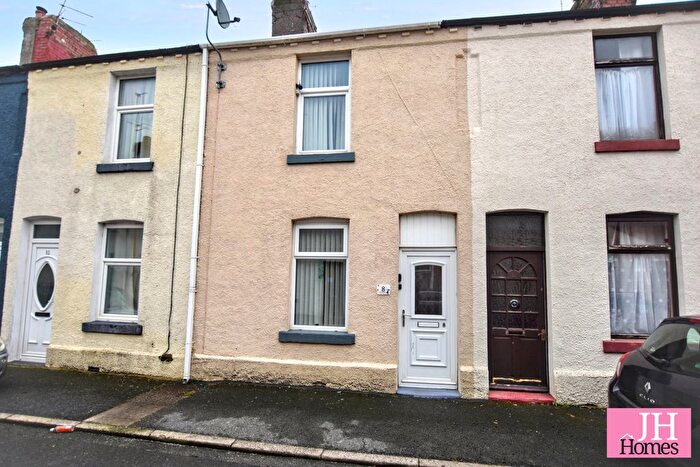
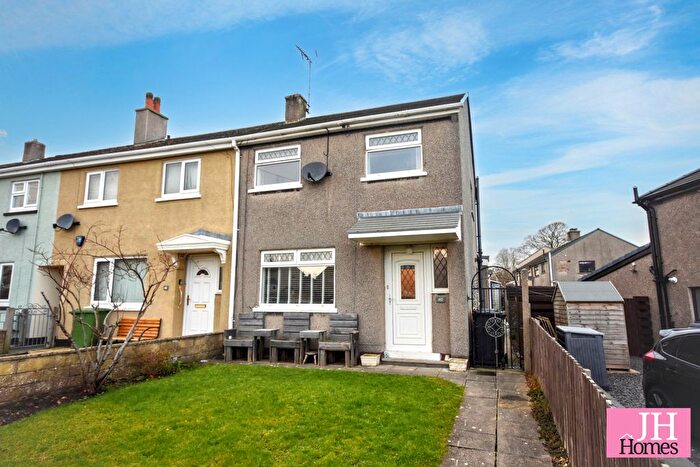
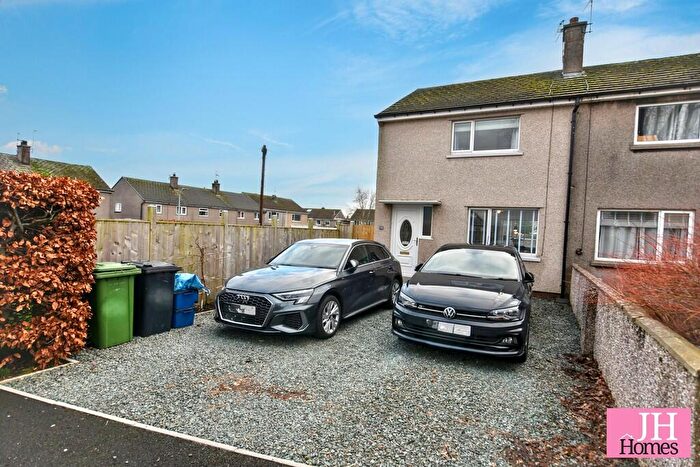
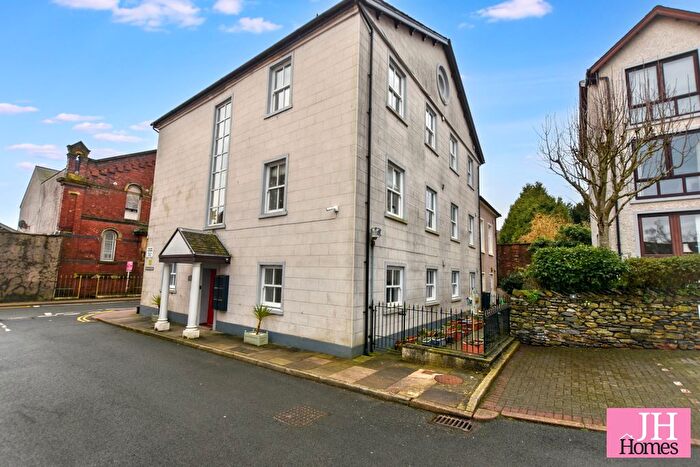
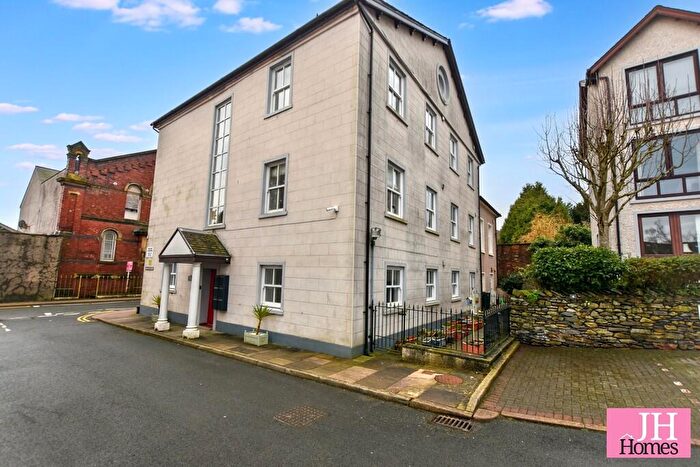
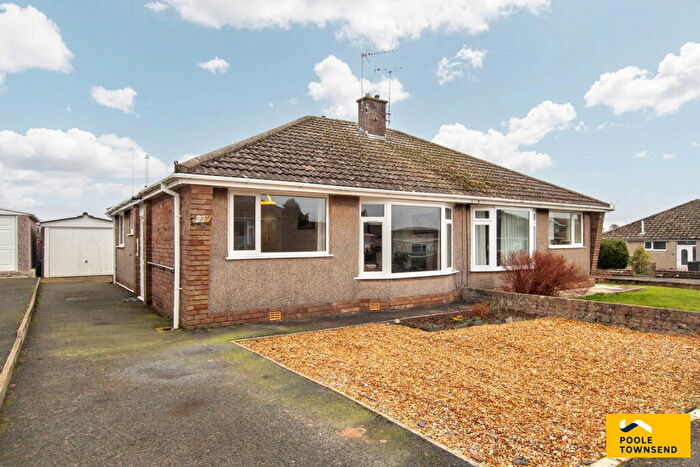
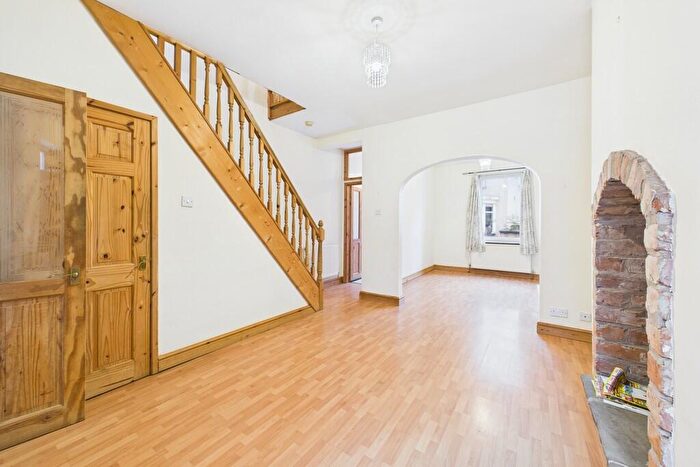
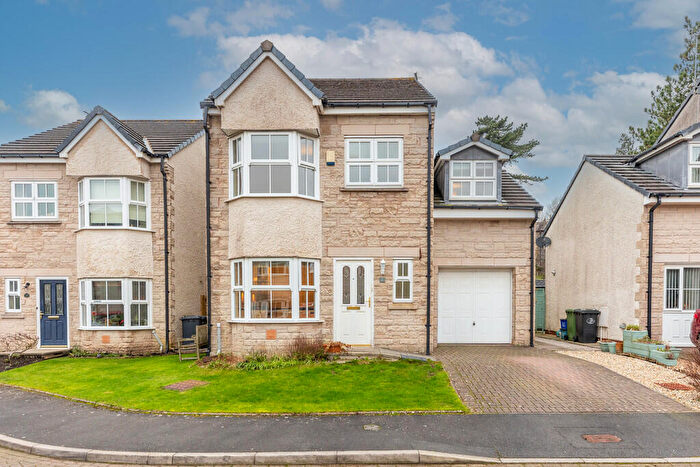
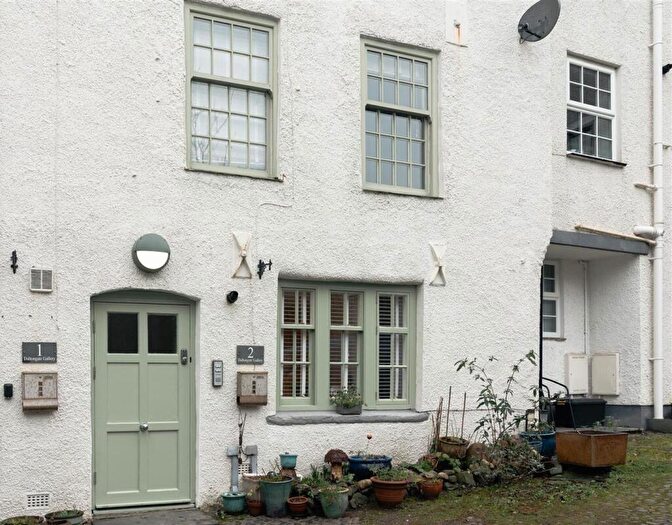
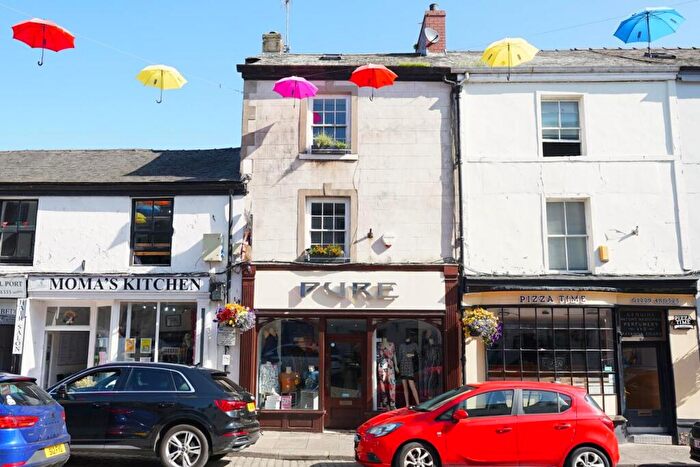
Houses for sale & to rent in Ulverston West, Ulverston
House Prices in Ulverston West
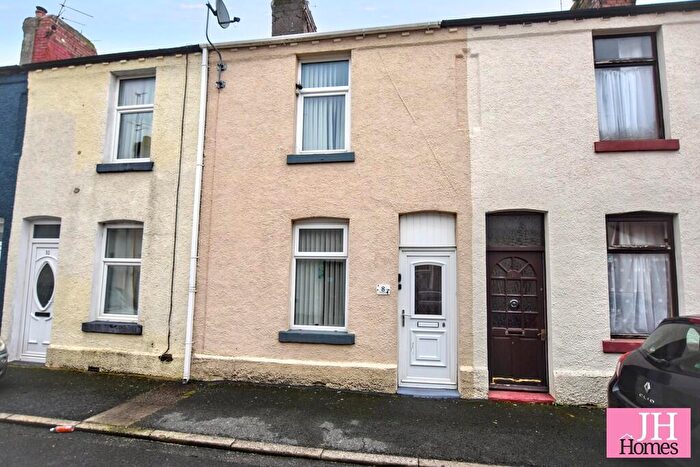
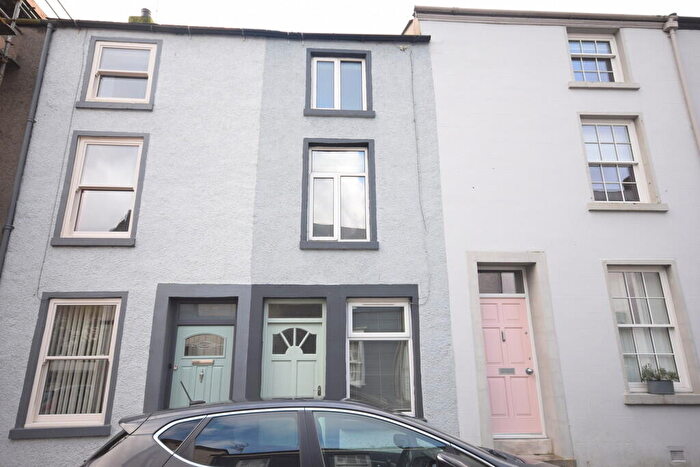
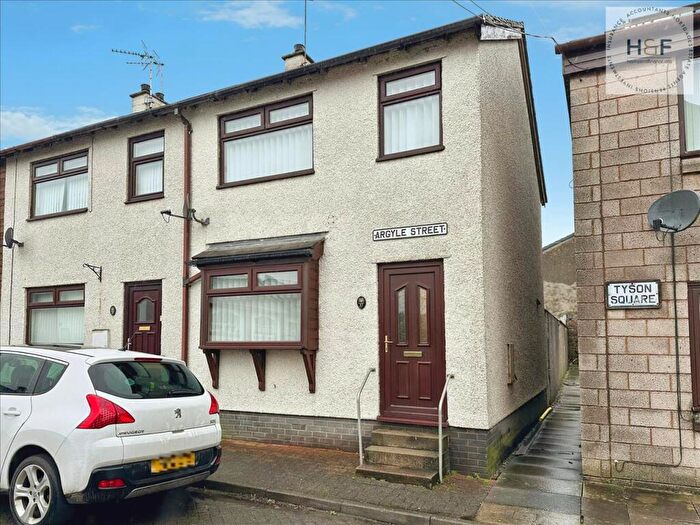
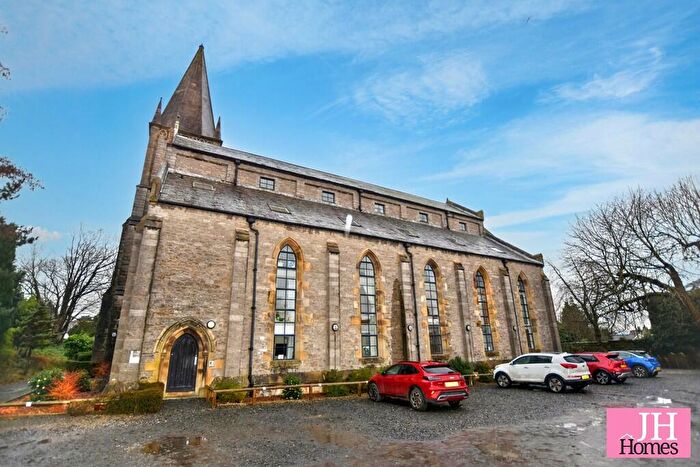
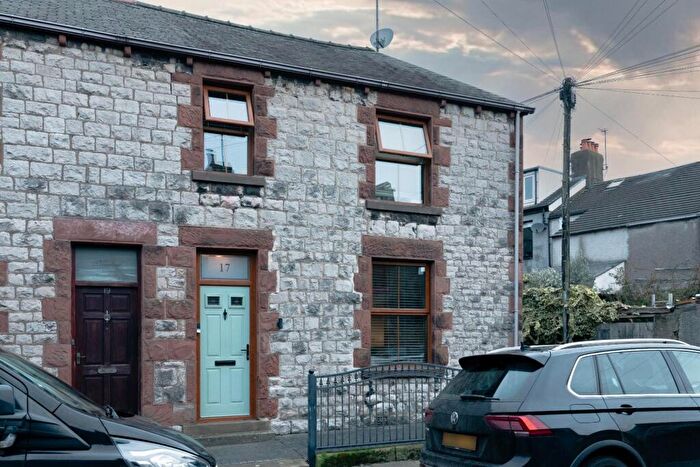
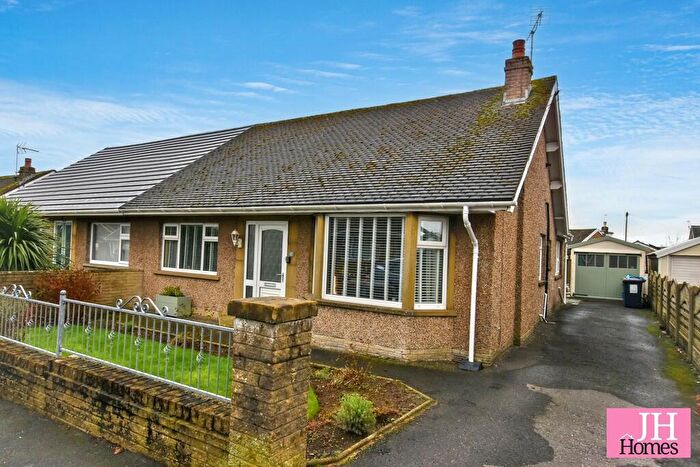
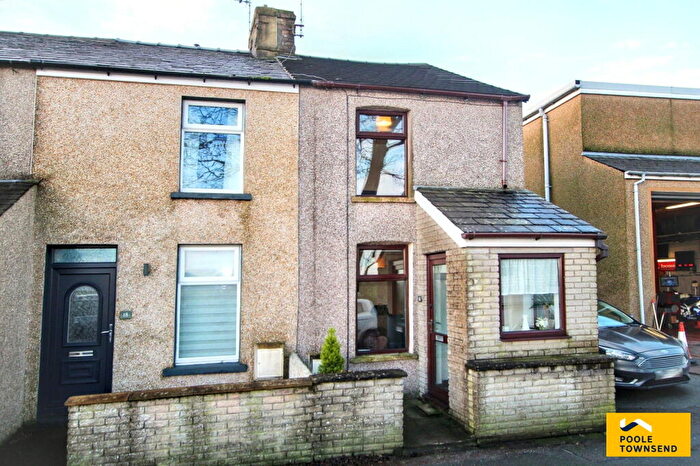
Properties in Ulverston West have an average house price of £343,549.00 and had 80 Property Transactions within the last 3 years¹.
Ulverston West is an area in Ulverston, Cumbria with 885 households², where the most expensive property was sold for £890,000.00.
Properties for sale in Ulverston West
Roads and Postcodes in Ulverston West
Navigate through our locations to find the location of your next house in Ulverston West, Ulverston for sale or to rent.
| Streets | Postcodes |
|---|---|
| Ash Grove | LA12 9JH |
| Back Sun Street | LA12 7BZ |
| Beehive Cottages | LA12 7NJ |
| Birkett Drive | LA12 9LN LA12 9LS LA12 9NB |
| Caraway Close | LA12 9NF |
| Carlton Drive | LA12 9LW |
| Colthouse Lane | LA12 0SF LA12 0SG |
| Daltongate | LA12 7BD LA12 7BE LA12 7RY |
| Daltongate Business Centre | LA12 7AJ |
| Deerfield | LA12 7XB |
| Dorchester Crescent | LA12 9LP |
| East Court | LA12 0UG |
| Fallowfield Avenue | LA12 7XD |
| Hallfield | LA12 9TA |
| Hazelcroft Gardens | LA12 7AN |
| Jefferson Drive | LA12 9LU |
| Kennedy Place | LA12 7FU LA12 7FX |
| Larch Grove | LA12 9HX |
| Laurel Gardens | LA12 7FT |
| Lightburn Industrial Estate | LA12 7NE |
| Lightburn Road | LA12 7ND LA12 7NG LA12 7TW |
| Lyndhurst Road | LA12 0EG |
| Machell Close | LA12 7XE |
| Mayfield Road | LA12 0DU |
| Meeting House Lane | LA12 9ND |
| Mill Street | LA12 7EB |
| Mountbarrow Road | LA12 9NH LA12 9NR |
| New Church Gardens | LA12 7AP |
| New Church Lane | LA12 7AE |
| Oakwood Drive | LA12 9RZ |
| Pennington Lane | LA12 7SE |
| Quaker Fold | LA12 9NE |
| Queen Street | LA12 7AF |
| Rake Head Close | LA12 9LQ |
| Rose Croft | LA12 9BF |
| Rusland Crescent | LA12 9LT LA12 9LX LA12 9LZ |
| Savoy Gardens | LA12 9LR |
| Springfield Avenue | LA12 0ED |
| Springfield Park Road | LA12 0EQ |
| Springfield Road | LA12 0DR LA12 0EA LA12 0EE LA12 0EJ LA12 0EF |
| Stanley Street | LA12 7BT LA12 7FJ |
| Station Approach | LA12 0DP |
| Stockbridge Lane | LA12 7BG LA12 7FR LA12 7NL |
| Stone Cross Gardens | LA12 7XA |
| Tarnfield Place | LA12 7FW |
| The Crest | LA12 0EH |
| The Drive | LA12 0DT LA12 0DY |
| The Gill | LA12 7BW |
| The Knoll | LA12 7TN |
| Three Bridges | LA12 0HG |
| Trinity Court | LA12 7NH |
| Trinity Gardens | LA12 7UB |
| Ulverston Road | LA12 0HQ |
| Urswick Road | LA12 9LF LA12 9LG LA12 9LH LA12 9LJ LA12 9LL |
| Westhills Drive | LA12 9QA |
| Weston Avenue | LA12 9LY |
| Woodland Road | LA12 0DX |
| LA12 0SE LA12 0JG LA12 0JQ LA12 7DU LA12 9QG |
Transport near Ulverston West
- FAQ
- Price Paid By Year
- Property Type Price
Frequently asked questions about Ulverston West
What is the average price for a property for sale in Ulverston West?
The average price for a property for sale in Ulverston West is £343,549. This amount is 19% higher than the average price in Ulverston. There are 562 property listings for sale in Ulverston West.
What streets have the most expensive properties for sale in Ulverston West?
The streets with the most expensive properties for sale in Ulverston West are Station Approach at an average of £667,000, Laurel Gardens at an average of £615,000 and Kennedy Place at an average of £526,658.
What streets have the most affordable properties for sale in Ulverston West?
The streets with the most affordable properties for sale in Ulverston West are Three Bridges at an average of £91,666, Trinity Court at an average of £161,862 and Queen Street at an average of £192,500.
Which train stations are available in or near Ulverston West?
Some of the train stations available in or near Ulverston West are Ulverston, Dalton and Askam.
Property Price Paid in Ulverston West by Year
The average sold property price by year was:
| Year | Average Sold Price | Price Change |
Sold Properties
|
|---|---|---|---|
| 2025 | £323,851 | -9% |
27 Properties |
| 2024 | £353,122 | -0,3% |
29 Properties |
| 2023 | £354,143 | 18% |
24 Properties |
| 2022 | £289,060 | -15% |
25 Properties |
| 2021 | £331,379 | 7% |
48 Properties |
| 2020 | £307,094 | -12% |
55 Properties |
| 2019 | £345,035 | 10% |
41 Properties |
| 2018 | £309,421 | 18% |
55 Properties |
| 2017 | £253,978 | -7% |
33 Properties |
| 2016 | £271,396 | -0,5% |
46 Properties |
| 2015 | £272,645 | 22% |
36 Properties |
| 2014 | £213,046 | 7% |
41 Properties |
| 2013 | £198,078 | -28% |
32 Properties |
| 2012 | £254,400 | -3% |
20 Properties |
| 2011 | £262,531 | 15% |
16 Properties |
| 2010 | £223,923 | 8% |
40 Properties |
| 2009 | £206,909 | -5% |
20 Properties |
| 2008 | £217,625 | -5% |
16 Properties |
| 2007 | £227,884 | 2% |
39 Properties |
| 2006 | £223,979 | 1% |
51 Properties |
| 2005 | £221,803 | 16% |
33 Properties |
| 2004 | £185,968 | 11% |
35 Properties |
| 2003 | £165,268 | 28% |
62 Properties |
| 2002 | £118,284 | -3% |
45 Properties |
| 2001 | £122,276 | 28% |
34 Properties |
| 2000 | £87,525 | 4% |
47 Properties |
| 1999 | £84,264 | -1% |
45 Properties |
| 1998 | £84,741 | 15% |
52 Properties |
| 1997 | £72,379 | -1% |
34 Properties |
| 1996 | £73,181 | 10% |
29 Properties |
| 1995 | £65,937 | - |
20 Properties |
Property Price per Property Type in Ulverston West
Here you can find historic sold price data in order to help with your property search.
The average Property Paid Price for specific property types in the last three years are:
| Property Type | Average Sold Price | Sold Properties |
|---|---|---|
| Semi Detached House | £310,501.00 | 36 Semi Detached Houses |
| Detached House | £473,178.00 | 28 Detached Houses |
| Terraced House | £232,812.00 | 8 Terraced Houses |
| Flat | £149,306.00 | 8 Flats |

