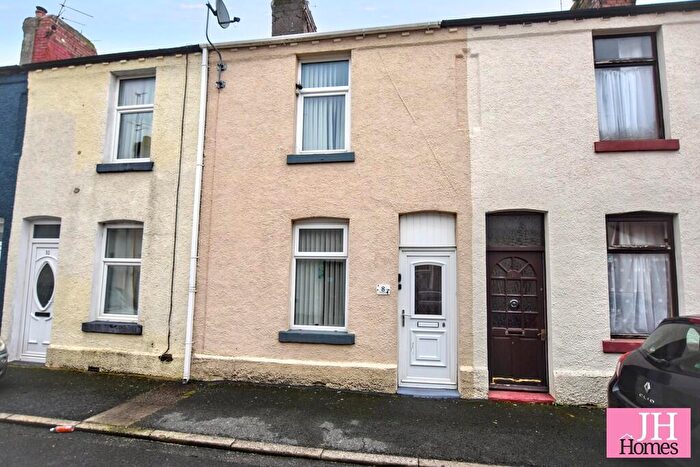
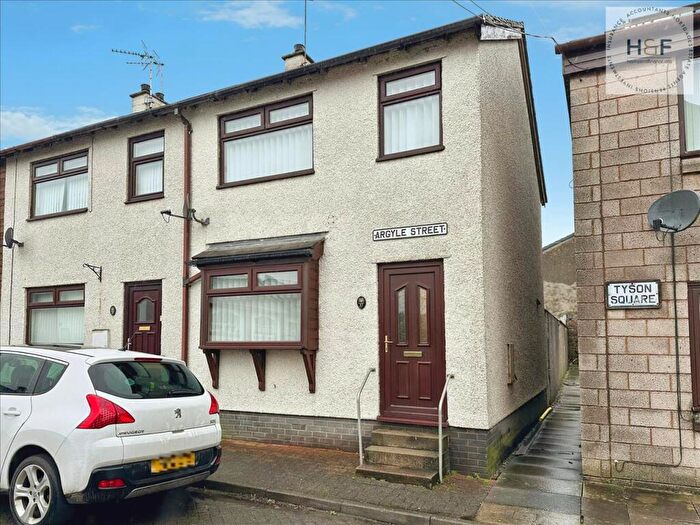
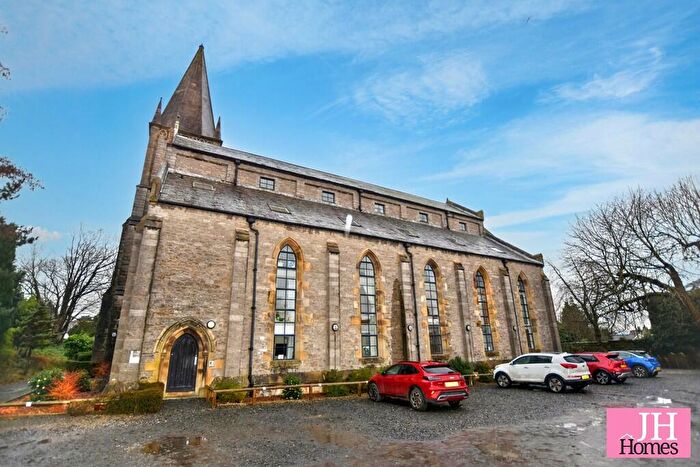
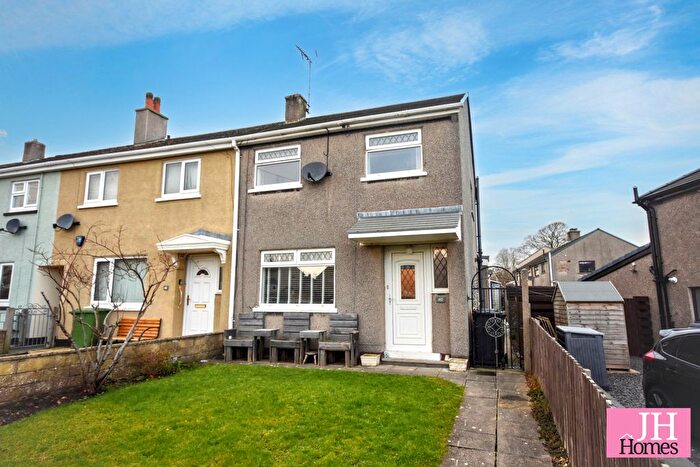
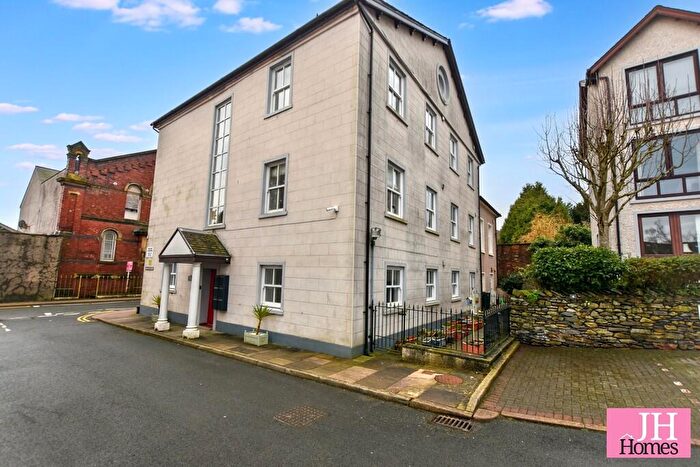
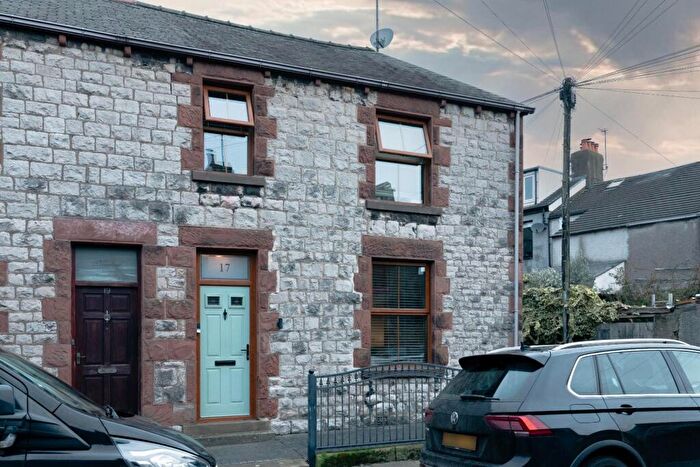
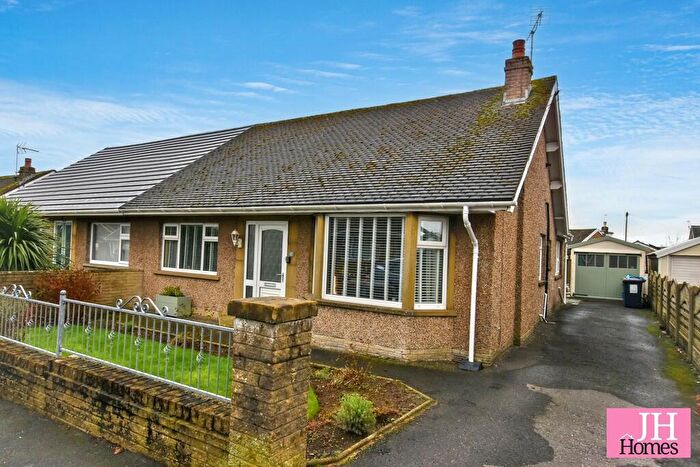
Houses for sale & to rent in Ulverston Central, Ulverston
House Prices in Ulverston Central
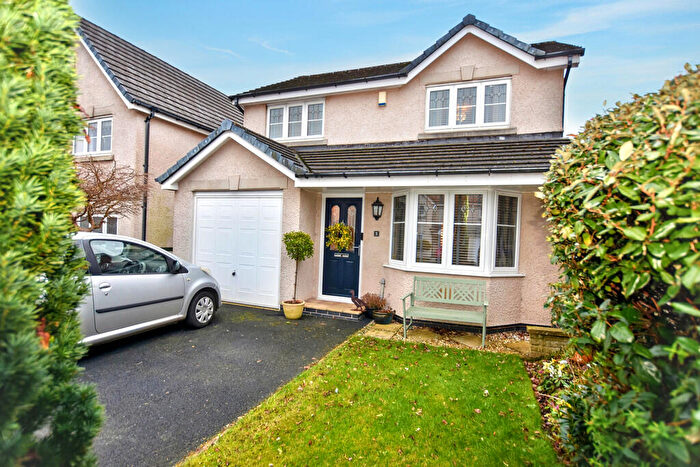
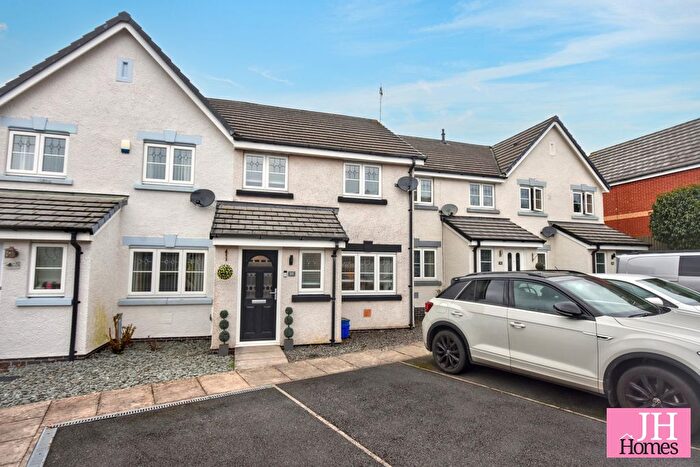
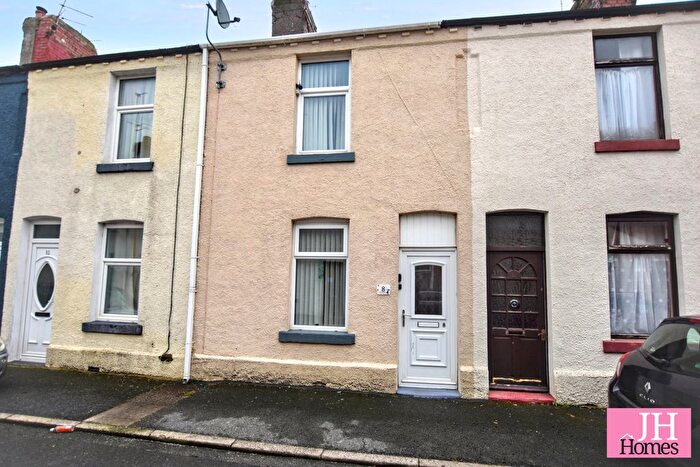
Properties in Ulverston Central have an average house price of £253,468.00 and had 53 Property Transactions within the last 3 years¹.
Ulverston Central is an area in Ulverston, Cumbria with 748 households², where the most expensive property was sold for £435,000.00.
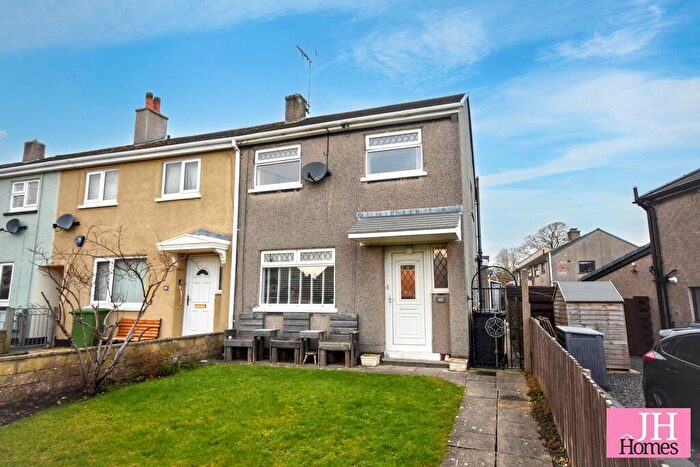
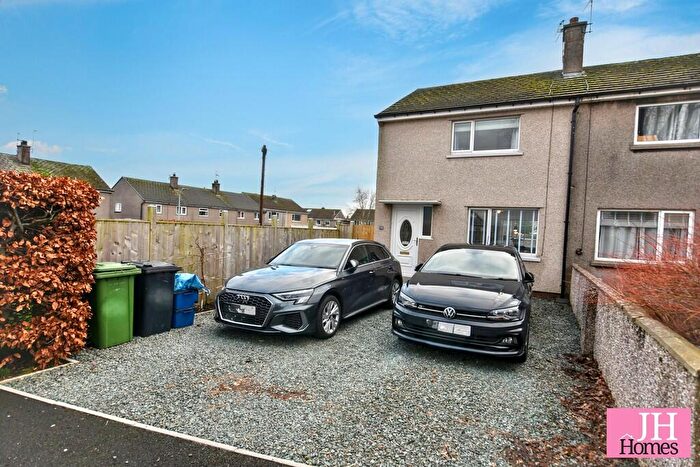
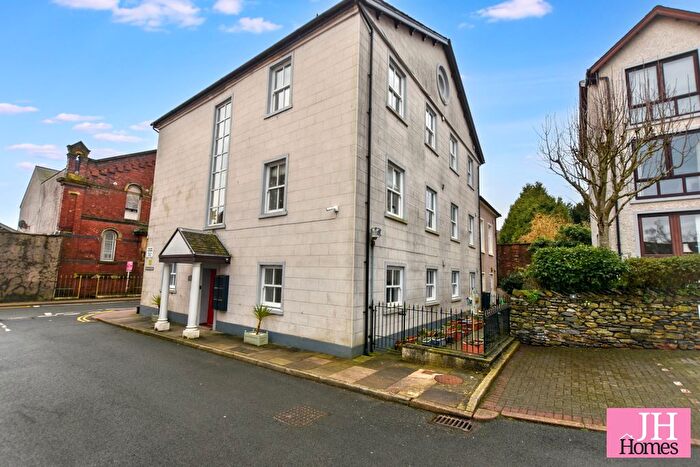
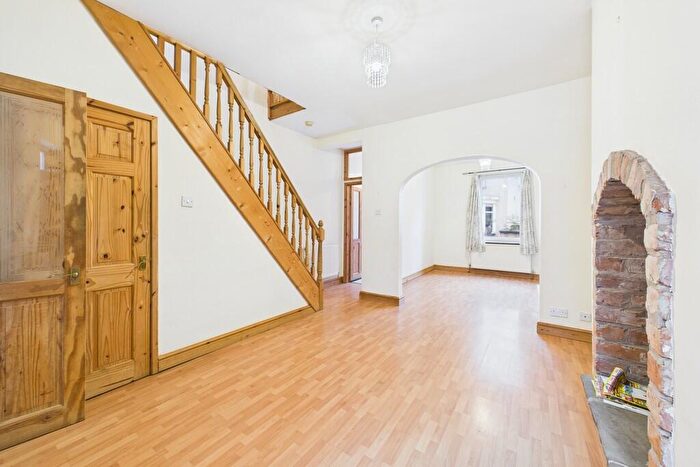
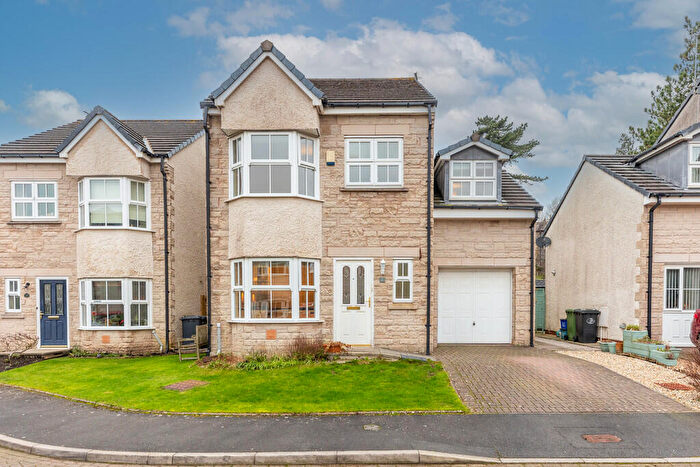
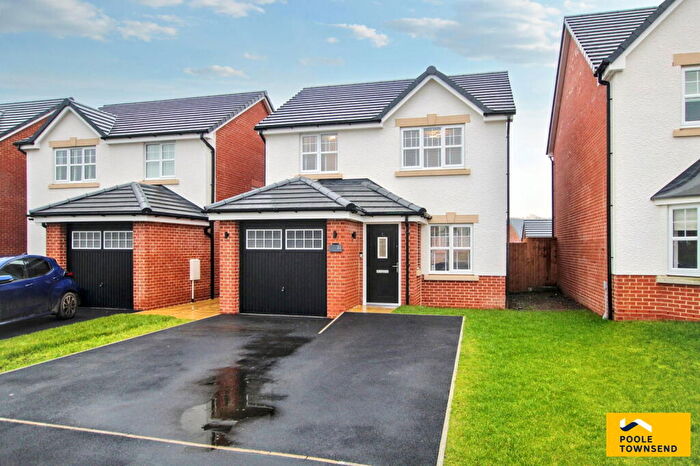
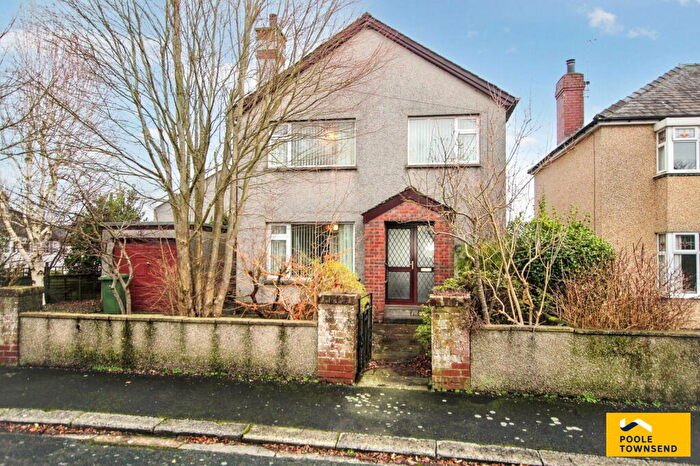
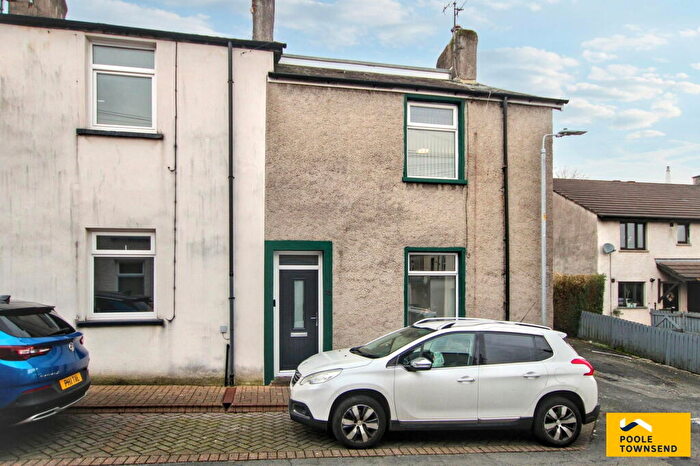
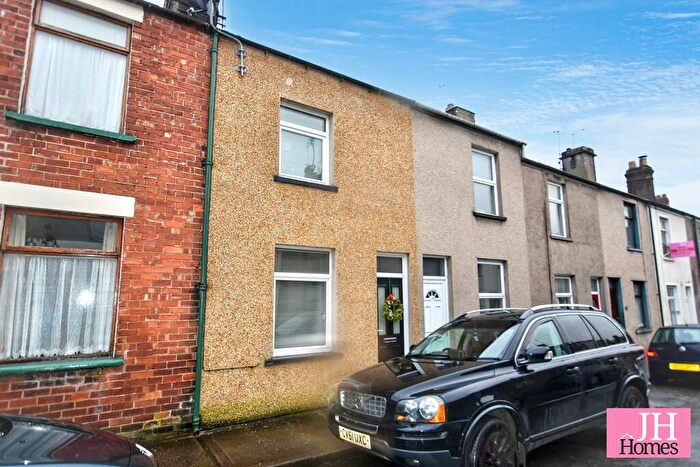
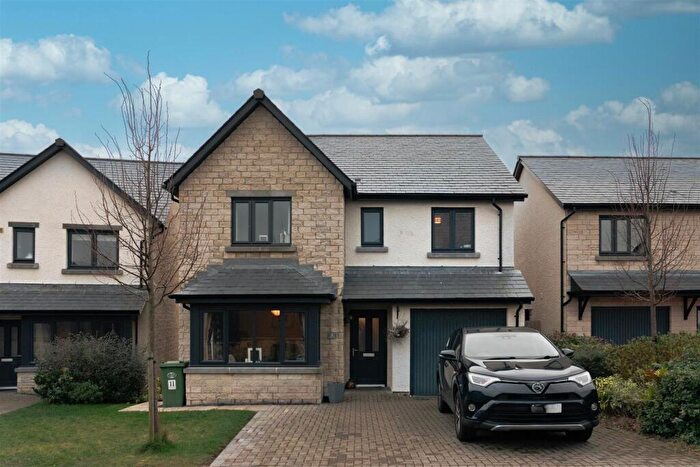
Properties for sale in Ulverston Central
Roads and Postcodes in Ulverston Central
Navigate through our locations to find the location of your next house in Ulverston Central, Ulverston for sale or to rent.
| Streets | Postcodes |
|---|---|
| Acacia Road | LA12 9LA |
| Aldwych Terrace | LA12 0EU |
| Bay Tree Road | LA12 9HL |
| Beech Drive | LA12 9EU LA12 9EX |
| Beechlands | LA12 9SQ |
| Braddyll Terrace | LA12 0DH |
| Central Drive | LA12 9JN LA12 9LD |
| Cherry Tree Avenue | LA12 9HE |
| Chestnut Grove | LA12 9HF |
| Conishead Road | LA12 0DQ |
| Dragley Beck | LA12 0HA LA12 0HD |
| Hawthorn Avenue | LA12 9JE |
| Heversham Close | LA12 9JD |
| Hillside Road | LA12 9LB |
| Holly Bank | LA12 9HJ |
| Lightburn Avenue | LA12 0DJ LA12 0DL |
| Lime Tree Road | LA12 9ET LA12 9EY LA12 9EZ |
| Maple Avenue | LA12 9JZ |
| Mount Barnard View | LA12 9JX |
| Oakwood Drive | LA12 9HA LA12 9HB LA12 9HH LA12 9JG LA12 9JJ LA12 9JY |
| Park Road | LA12 0ET |
| Pine Tree Road | LA12 9HD |
| Priory Court | LA12 0EY |
| Priory Crossing | LA12 9QD |
| Priory Road | LA12 9HN LA12 9HR LA12 9HS LA12 9RX |
| Rake Lane | LA12 0HB LA12 9NG |
| Rowan Avenue | LA12 9HG LA12 9HQ LA12 9HZ LA12 9JA |
| Swarthdale Avenue | LA12 9HY |
| Sycamore Avenue | LA12 9ES |
| The Coppice | LA12 9LE |
| Underwood Road | LA12 9JF |
| Victoria Road | LA12 0EN LA12 0EP |
| Well Lane | LA12 0EX |
| Yealand Drive | LA12 9JB |
| LA12 0ES |
Transport near Ulverston Central
- FAQ
- Price Paid By Year
- Property Type Price
Frequently asked questions about Ulverston Central
What is the average price for a property for sale in Ulverston Central?
The average price for a property for sale in Ulverston Central is £253,468. This amount is 12% lower than the average price in Ulverston. There are 475 property listings for sale in Ulverston Central.
What streets have the most expensive properties for sale in Ulverston Central?
The streets with the most expensive properties for sale in Ulverston Central are Braddyll Terrace at an average of £410,000, Yealand Drive at an average of £360,000 and Victoria Road at an average of £345,000.
What streets have the most affordable properties for sale in Ulverston Central?
The streets with the most affordable properties for sale in Ulverston Central are Cherry Tree Avenue at an average of £170,000, Beech Drive at an average of £184,666 and Lime Tree Road at an average of £199,500.
Which train stations are available in or near Ulverston Central?
Some of the train stations available in or near Ulverston Central are Ulverston, Dalton and Askam.
Property Price Paid in Ulverston Central by Year
The average sold property price by year was:
| Year | Average Sold Price | Price Change |
Sold Properties
|
|---|---|---|---|
| 2025 | £262,600 | 7% |
15 Properties |
| 2024 | £243,714 | -4% |
14 Properties |
| 2023 | £253,451 | -14% |
24 Properties |
| 2022 | £287,875 | 22% |
12 Properties |
| 2021 | £224,264 | 6% |
45 Properties |
| 2020 | £210,627 | 12% |
33 Properties |
| 2019 | £185,365 | -6% |
19 Properties |
| 2018 | £196,690 | 1% |
21 Properties |
| 2017 | £194,435 | -14% |
21 Properties |
| 2016 | £221,908 | 18% |
28 Properties |
| 2015 | £182,094 | 12% |
26 Properties |
| 2014 | £160,282 | 14% |
26 Properties |
| 2013 | £138,382 | -14% |
21 Properties |
| 2012 | £158,203 | -5% |
16 Properties |
| 2011 | £165,611 | 4% |
18 Properties |
| 2010 | £159,802 | 5% |
18 Properties |
| 2009 | £152,181 | -16% |
11 Properties |
| 2008 | £176,404 | 13% |
21 Properties |
| 2007 | £154,234 | -13% |
34 Properties |
| 2006 | £174,627 | 18% |
22 Properties |
| 2005 | £142,511 | 11% |
29 Properties |
| 2004 | £127,462 | 24% |
28 Properties |
| 2003 | £97,358 | 18% |
22 Properties |
| 2002 | £80,197 | 15% |
34 Properties |
| 2001 | £67,774 | 6% |
31 Properties |
| 2000 | £64,030 | -12% |
15 Properties |
| 1999 | £71,933 | 9% |
32 Properties |
| 1998 | £65,328 | 11% |
26 Properties |
| 1997 | £58,391 | -3% |
19 Properties |
| 1996 | £60,065 | -5% |
29 Properties |
| 1995 | £62,847 | - |
23 Properties |
Property Price per Property Type in Ulverston Central
Here you can find historic sold price data in order to help with your property search.
The average Property Paid Price for specific property types in the last three years are:
| Property Type | Average Sold Price | Sold Properties |
|---|---|---|
| Semi Detached House | £213,480.00 | 25 Semi Detached Houses |
| Detached House | £331,448.00 | 13 Detached Houses |
| Terraced House | £252,533.00 | 15 Terraced Houses |

