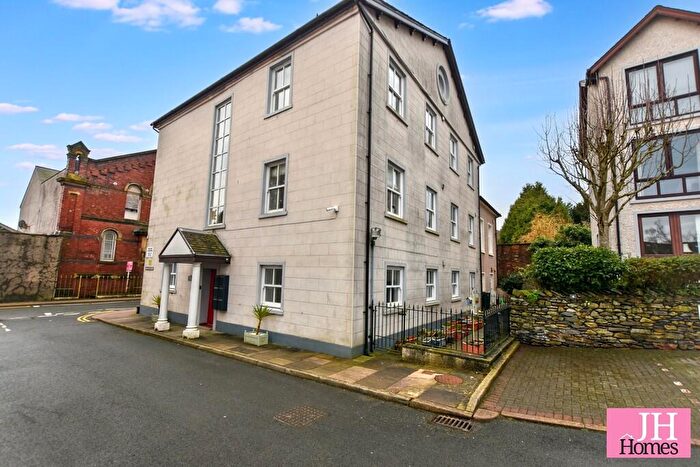
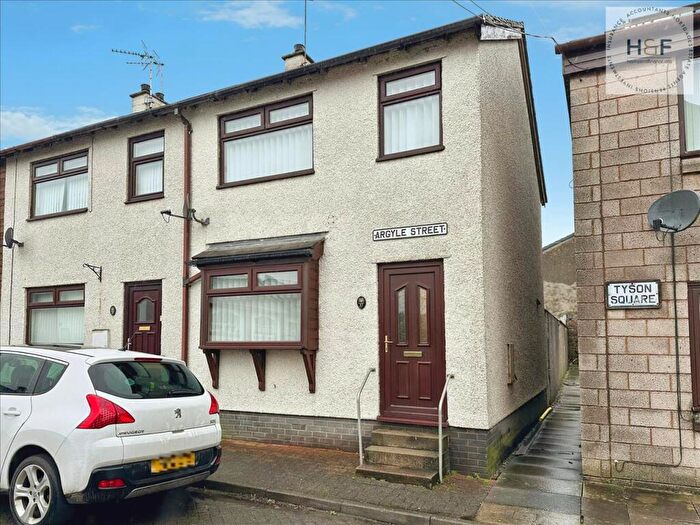
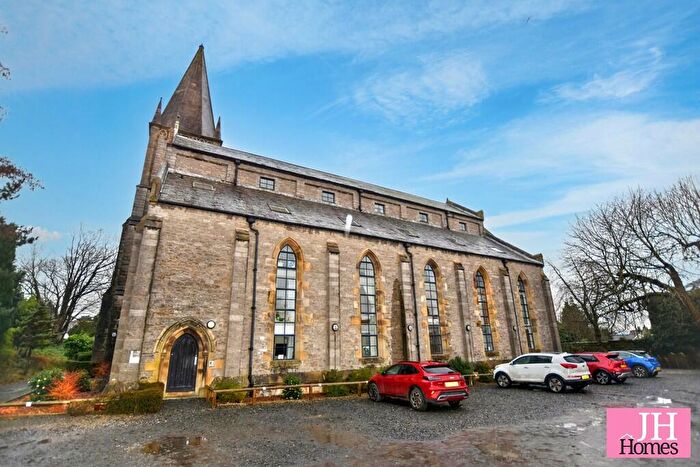
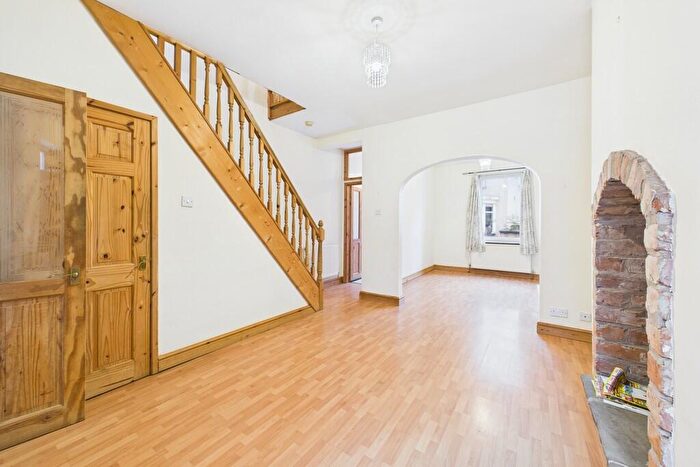
Houses for sale & to rent in Ulverston North, Ulverston
House Prices in Ulverston North
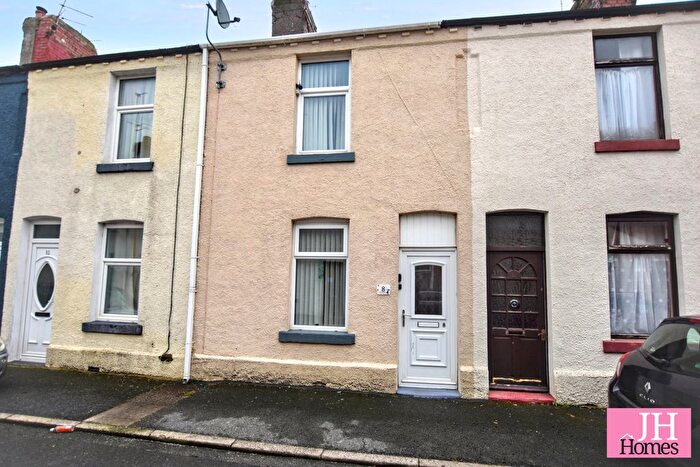
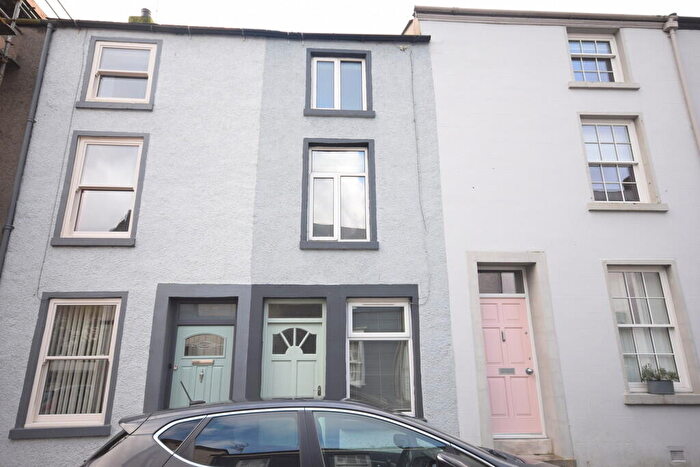
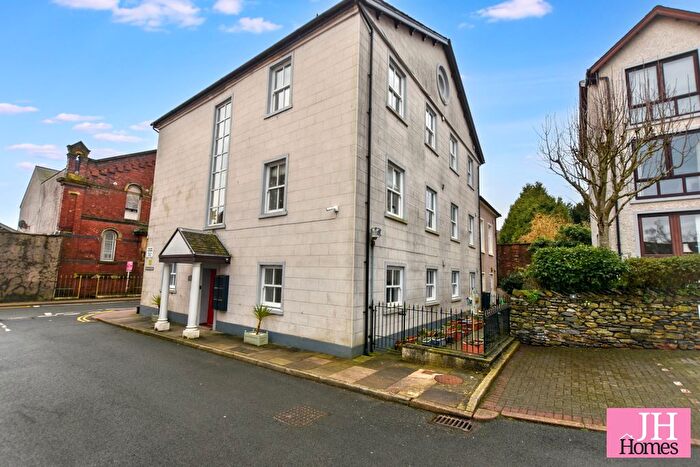
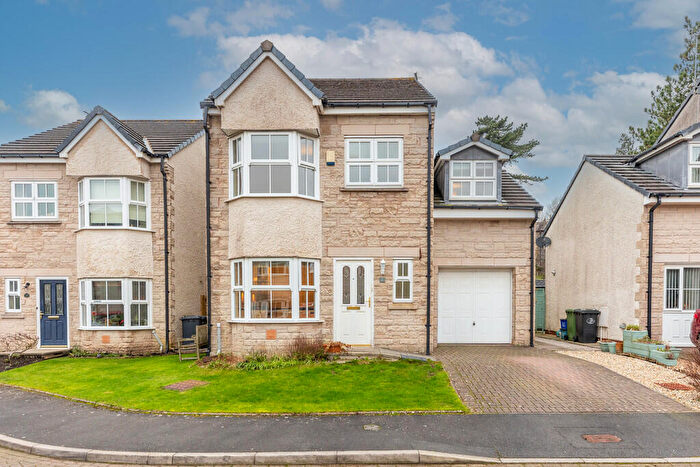
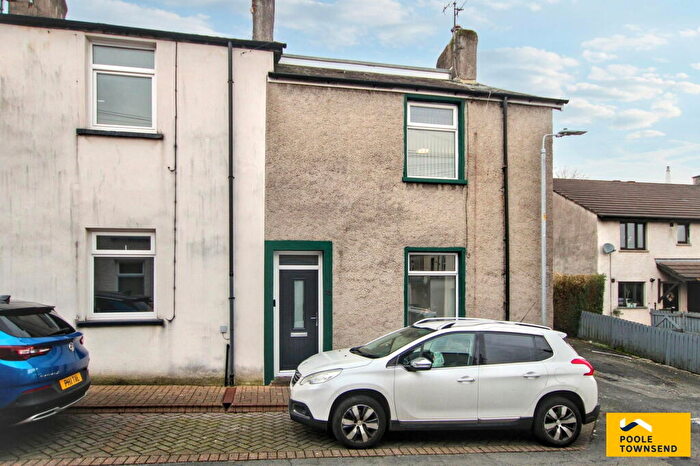
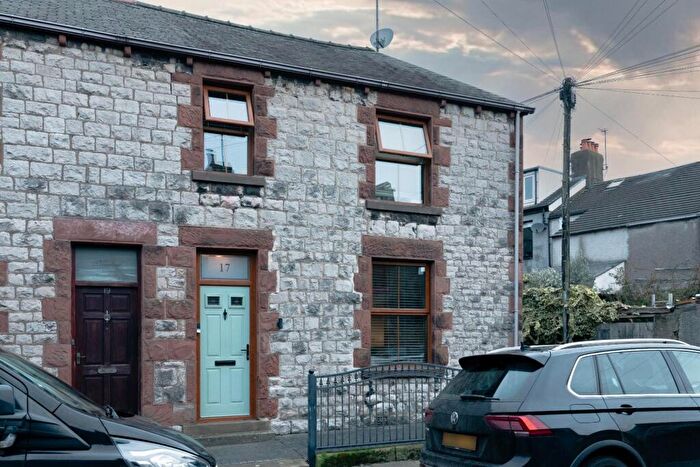
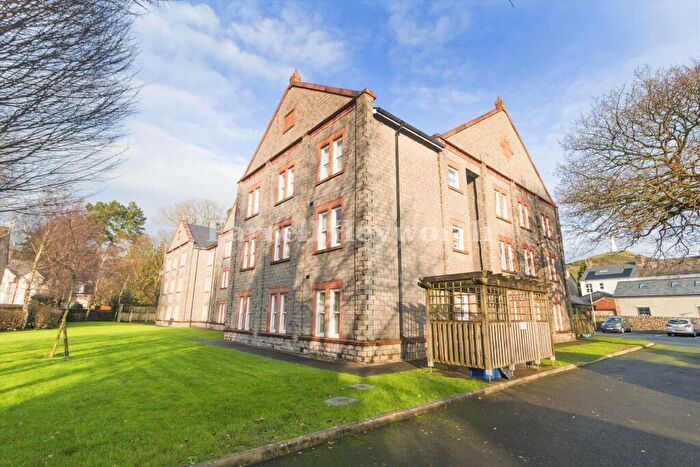
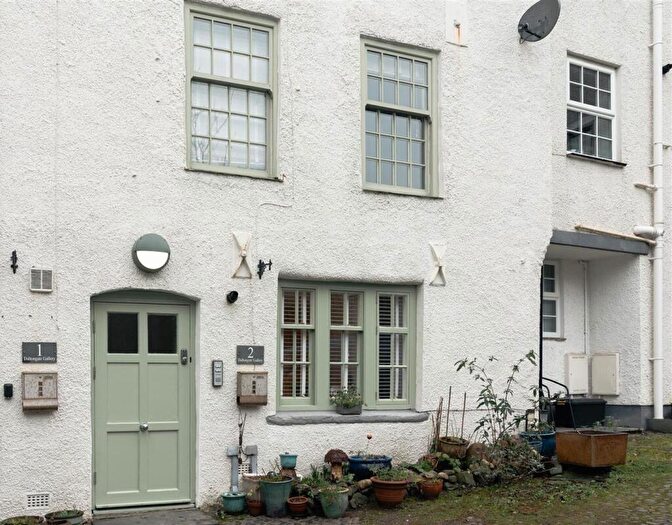
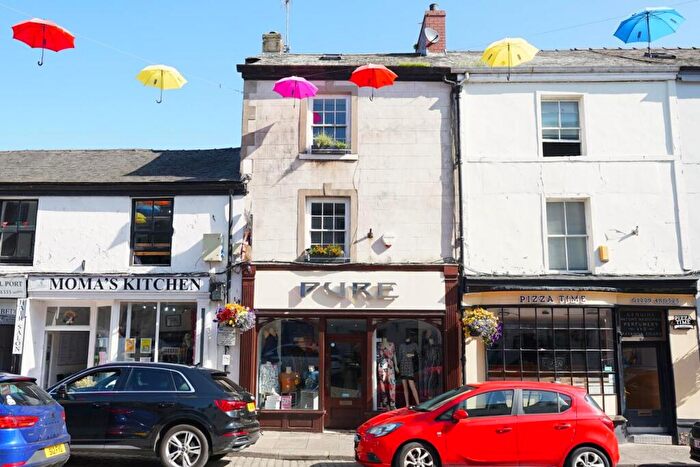
Properties in Ulverston North have an average house price of £266,393.00 and had 115 Property Transactions within the last 3 years¹.
Ulverston North is an area in Ulverston, Cumbria with 948 households², where the most expensive property was sold for £725,000.00.
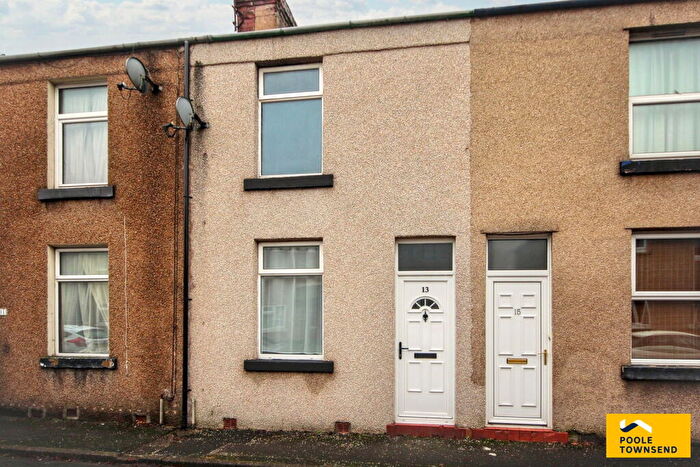
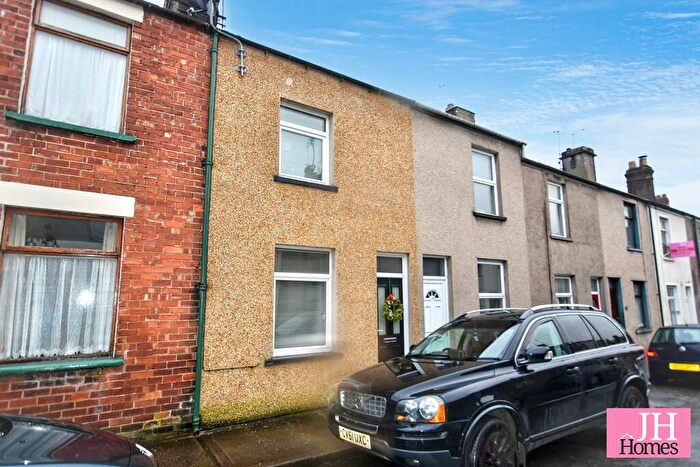
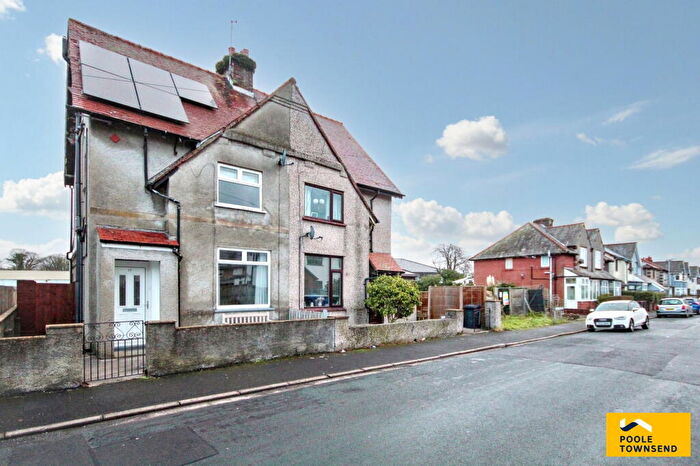
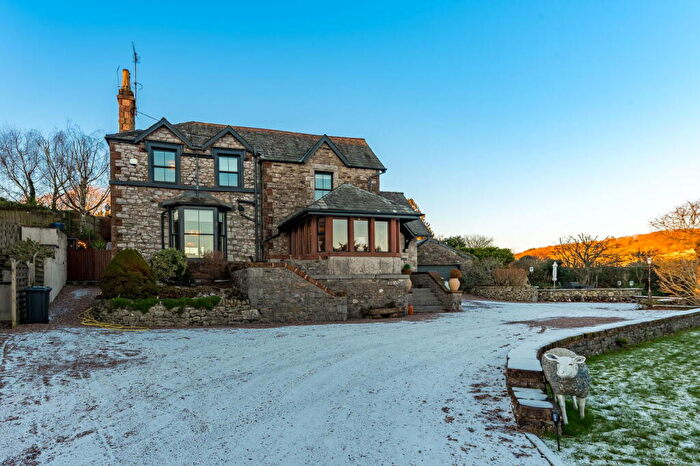
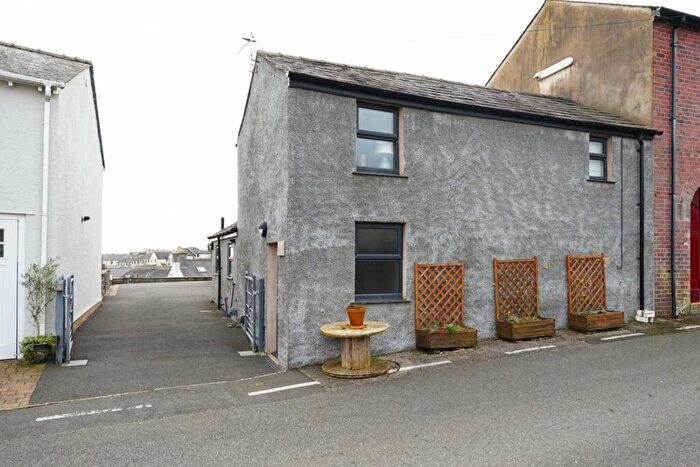
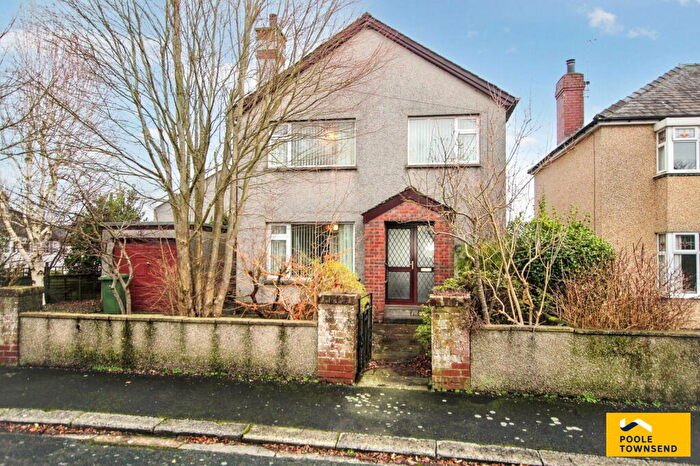
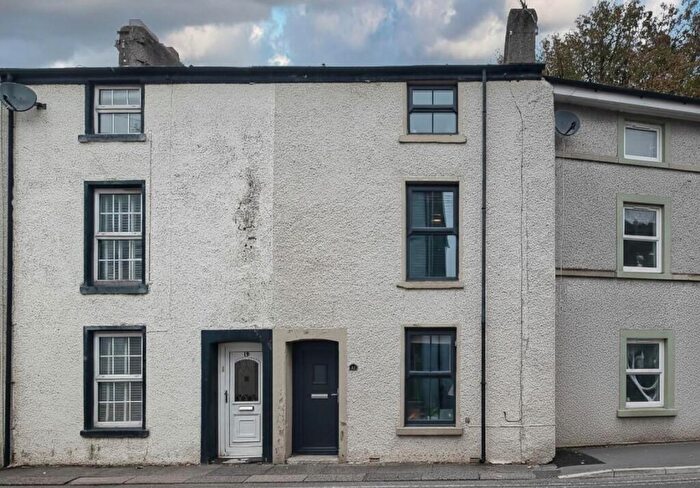
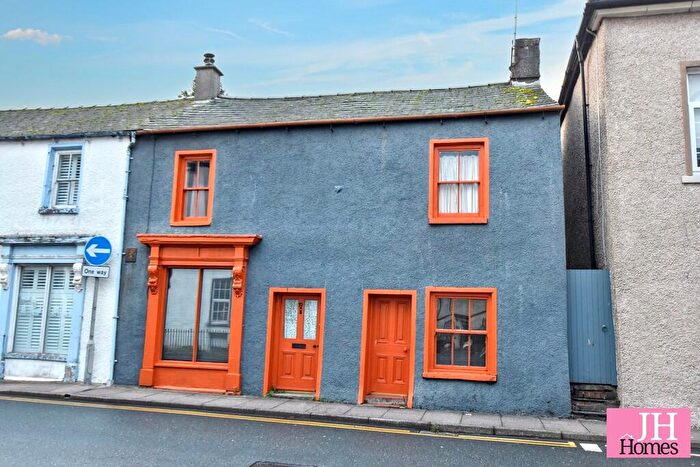
Properties for sale in Ulverston North
Roads and Postcodes in Ulverston North
Navigate through our locations to find the location of your next house in Ulverston North, Ulverston for sale or to rent.
| Streets | Postcodes |
|---|---|
| Ainsworth Street | LA12 7EU |
| Back Lane | LA12 7EP |
| Beckside Road | LA12 7DE |
| Beech Bank | LA12 7EZ |
| Belmont | LA12 7HD |
| Brooks Cottages | LA12 7DH |
| Bugle Horn Hill | LA12 7ET |
| Canal Street | LA12 7JZ |
| Chittery Lane | LA12 7DP |
| Church Fields Avenue | LA12 7HE LA12 7HJ |
| Church Walk | LA12 7EN LA12 7EW |
| Collins Brook Court | LA12 7FL |
| Daltongate Court | LA12 7UA |
| Flan Close | LA12 7DW |
| Ford Park | LA12 7JP |
| Ford Park Crescent | LA12 7JR LA12 7JW LA12 7TS |
| Garden Terrace | LA12 7DA |
| Gill Garth | LA12 7FF |
| Green Bank | LA12 7HA |
| Hart Street | LA12 7HY |
| Hoad Lane | LA12 7LD |
| Hoad Terrace | LA12 7DJ |
| King Street | LA12 7DZ |
| Ladies Walk | LA12 7HB |
| Leather Lane | LA12 7DT |
| Mowings Lane | LA12 7DB LA12 7DD |
| Old Hall Drive | LA12 7DG |
| Old Hall Road | LA12 7DF LA12 7DL LA12 7DQ |
| Oubas Hill | LA12 7LA |
| Poplar Grove | LA12 7JU |
| Sea View | LA12 7EX |
| Soutergate | LA12 7ER LA12 7ES LA12 7FA |
| St Davids Road | LA12 7HF |
| St Marys Mews | LA12 7HL |
| Stanley Street | LA12 7BS |
| Star Street | LA12 7BY |
| Sun Street | LA12 7BX |
| Sunderland Terrace | LA12 7JY |
| Tarn Side | LA12 7EL |
| The Gill | LA12 7BJ LA12 7BL LA12 7BN LA12 7BP |
| Town Bank Road | LA12 7DN LA12 7DR |
| Town Bank Terrace | LA12 7DS |
| Town Street | LA12 7EY |
| Town View Road | LA12 7HH |
| Union Close | LA12 7FQ |
| Union Lane | LA12 7BU |
| Upper Brook Street | LA12 7BH |
| Victoria Park | LA12 7TT |
| Whinfield Road | LA12 7HG LA12 7HQ |
| White Hart Yard | LA12 7BB |
| Willow Tree Close | LA12 7GY |
| Willowdene Gardens | LA12 7WG |
Transport near Ulverston North
- FAQ
- Price Paid By Year
- Property Type Price
Frequently asked questions about Ulverston North
What is the average price for a property for sale in Ulverston North?
The average price for a property for sale in Ulverston North is £266,393. This amount is 8% lower than the average price in Ulverston. There are 226 property listings for sale in Ulverston North.
What streets have the most expensive properties for sale in Ulverston North?
The streets with the most expensive properties for sale in Ulverston North are Star Street at an average of £518,750, Sea View at an average of £495,000 and St Davids Road at an average of £412,500.
What streets have the most affordable properties for sale in Ulverston North?
The streets with the most affordable properties for sale in Ulverston North are Canal Street at an average of £110,166, Upper Brook Street at an average of £120,337 and Brooks Cottages at an average of £127,750.
Which train stations are available in or near Ulverston North?
Some of the train stations available in or near Ulverston North are Ulverston, Kirkby-In-Furness and Askam.
Property Price Paid in Ulverston North by Year
The average sold property price by year was:
| Year | Average Sold Price | Price Change |
Sold Properties
|
|---|---|---|---|
| 2025 | £240,684 | -15% |
42 Properties |
| 2024 | £275,720 | -4% |
35 Properties |
| 2023 | £286,218 | 8% |
38 Properties |
| 2022 | £262,348 | 8% |
45 Properties |
| 2021 | £240,097 | -13% |
53 Properties |
| 2020 | £272,374 | 30% |
26 Properties |
| 2019 | £191,771 | -7% |
45 Properties |
| 2018 | £204,790 | -3% |
50 Properties |
| 2017 | £211,145 | 4% |
37 Properties |
| 2016 | £202,887 | -12% |
43 Properties |
| 2015 | £226,721 | 17% |
42 Properties |
| 2014 | £188,613 | -1% |
69 Properties |
| 2013 | £191,035 | 3% |
42 Properties |
| 2012 | £184,742 | 11% |
32 Properties |
| 2011 | £164,551 | -11% |
44 Properties |
| 2010 | £183,046 | 7% |
41 Properties |
| 2009 | £169,334 | -5% |
35 Properties |
| 2008 | £178,090 | 7% |
26 Properties |
| 2007 | £165,989 | 8% |
64 Properties |
| 2006 | £151,886 | 7% |
96 Properties |
| 2005 | £140,807 | 5% |
73 Properties |
| 2004 | £133,125 | 13% |
41 Properties |
| 2003 | £115,873 | 16% |
52 Properties |
| 2002 | £97,568 | 24% |
50 Properties |
| 2001 | £74,032 | 15% |
47 Properties |
| 2000 | £63,058 | -3% |
48 Properties |
| 1999 | £64,904 | 8% |
53 Properties |
| 1998 | £59,665 | 9% |
56 Properties |
| 1997 | £54,186 | 2% |
52 Properties |
| 1996 | £53,362 | -8% |
46 Properties |
| 1995 | £57,577 | - |
38 Properties |
Property Price per Property Type in Ulverston North
Here you can find historic sold price data in order to help with your property search.
The average Property Paid Price for specific property types in the last three years are:
| Property Type | Average Sold Price | Sold Properties |
|---|---|---|
| Semi Detached House | £313,930.00 | 28 Semi Detached Houses |
| Detached House | £462,357.00 | 14 Detached Houses |
| Terraced House | £215,653.00 | 57 Terraced Houses |
| Flat | £192,500.00 | 16 Flats |

