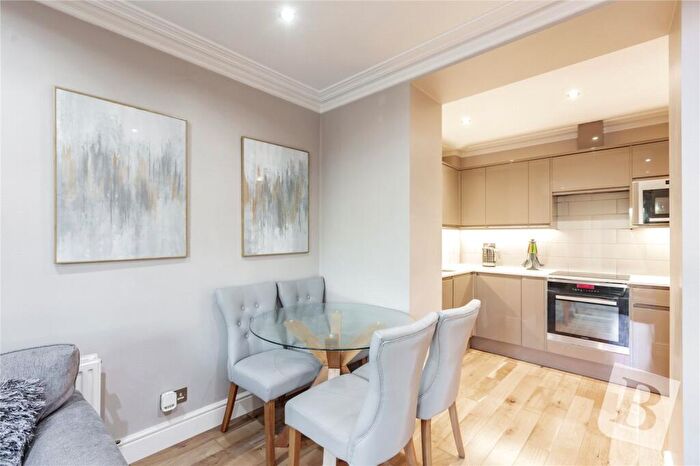
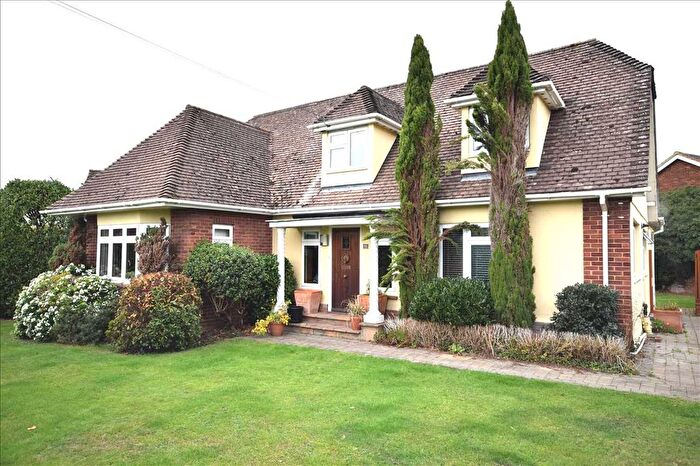
Houses for sale & to rent in St Andrews, Chelmsford
House Prices in St Andrews
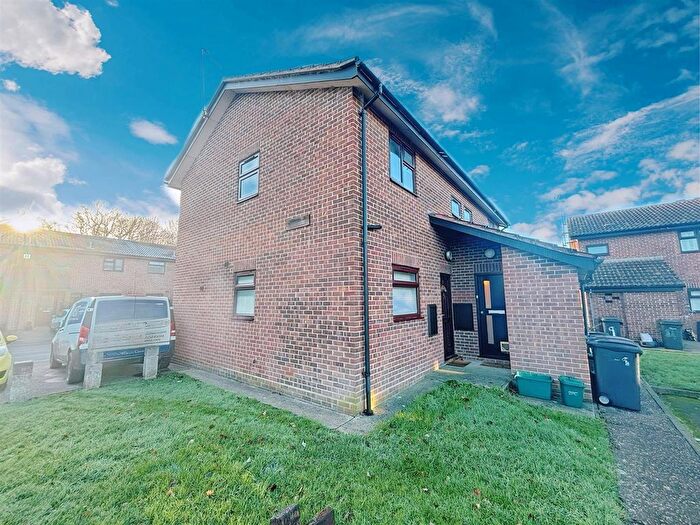
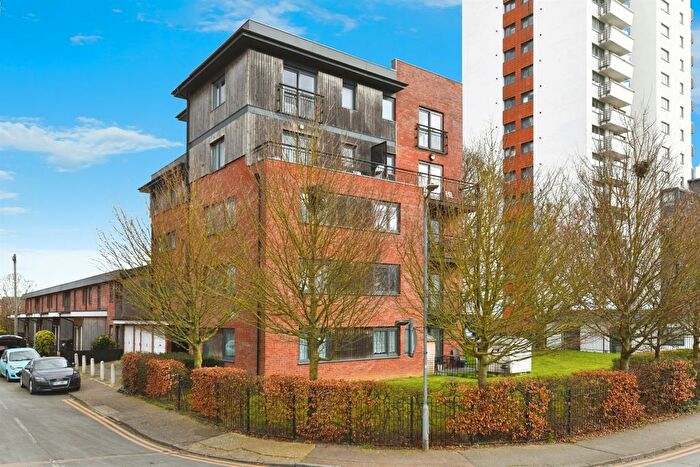
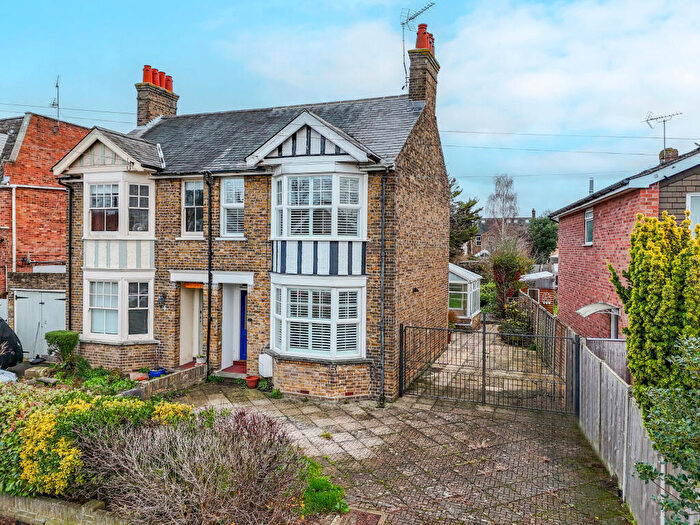
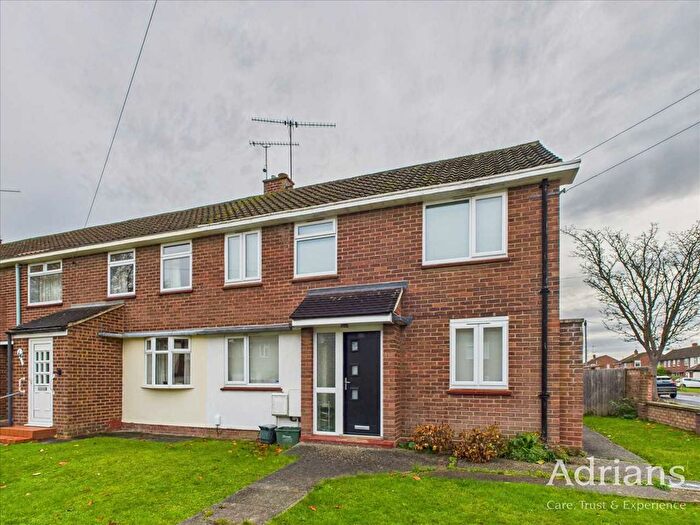
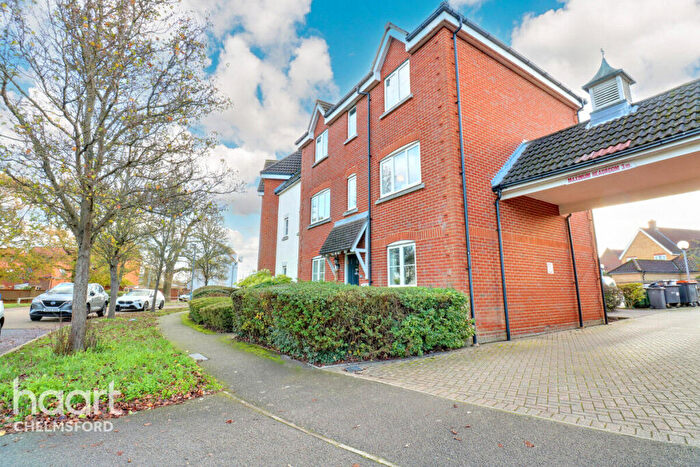
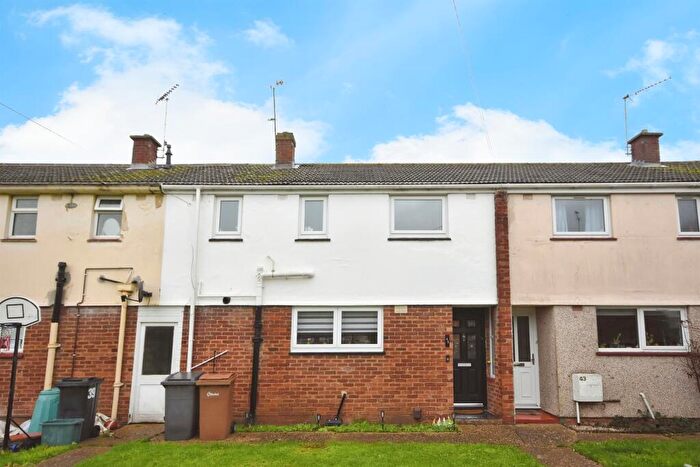
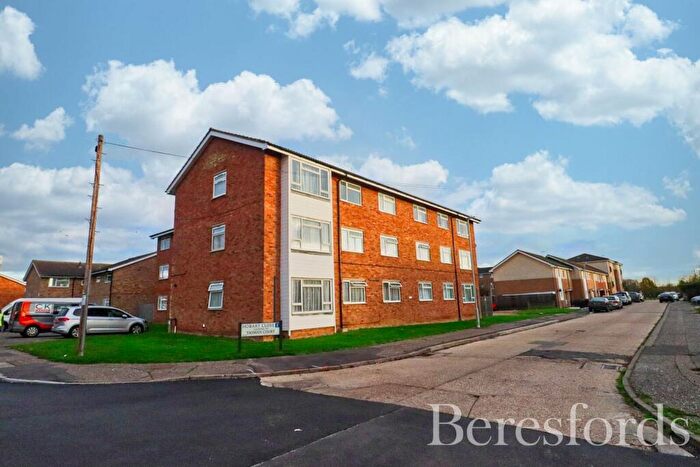
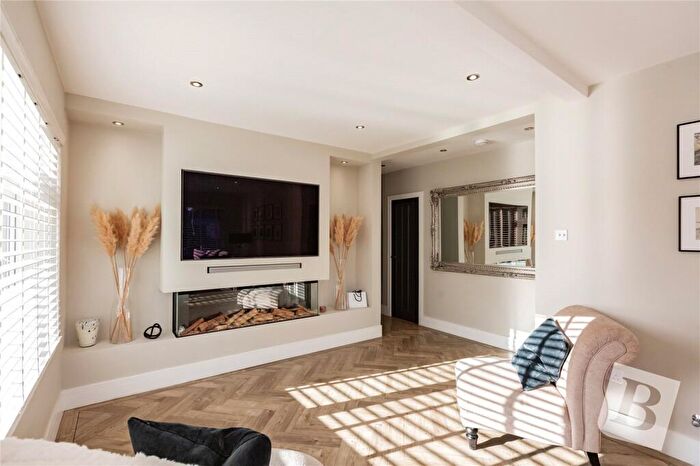
Properties in St Andrews have an average house price of £413,756.00 and had 364 Property Transactions within the last 3 years¹.
St Andrews is an area in Chelmsford, Essex with 3,798 households², where the most expensive property was sold for £1,350,000.00.
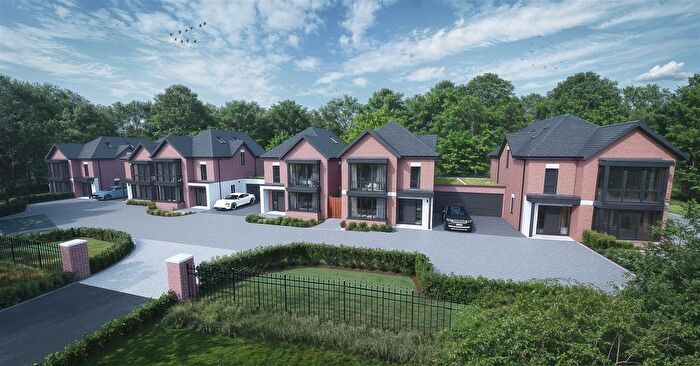
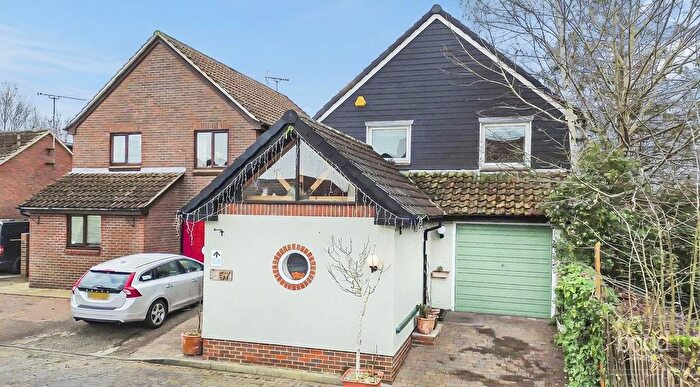
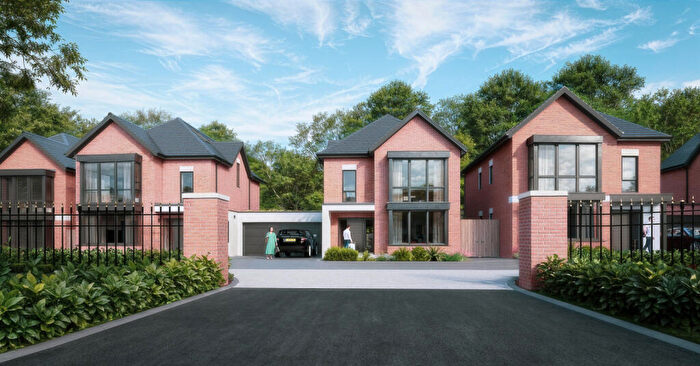
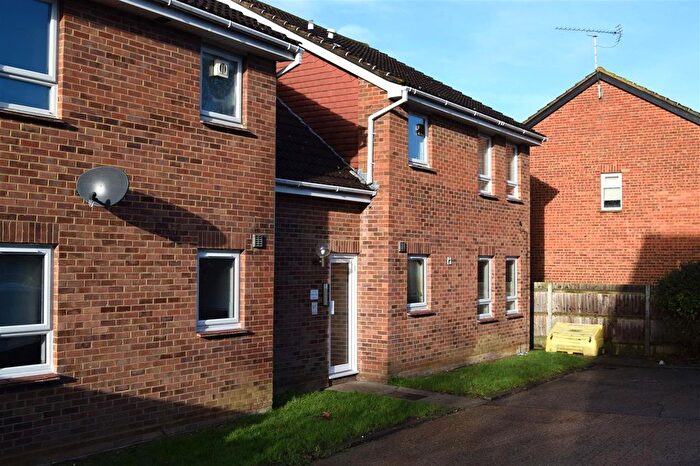
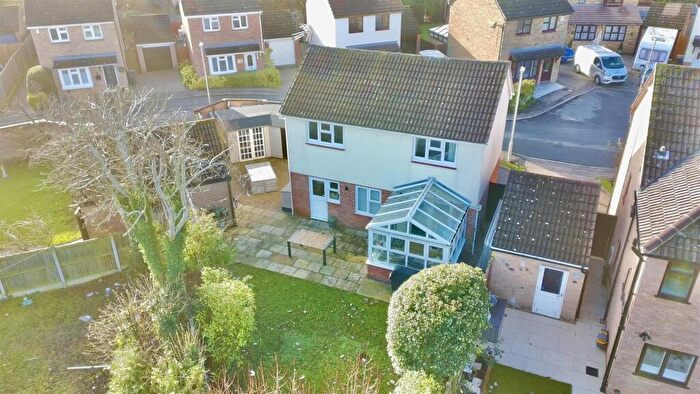
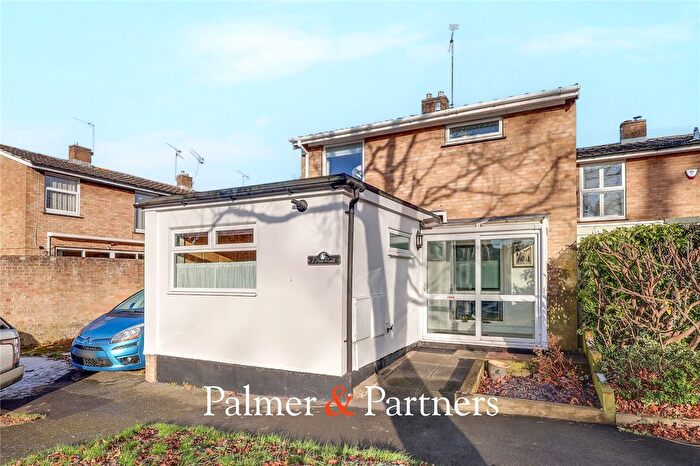
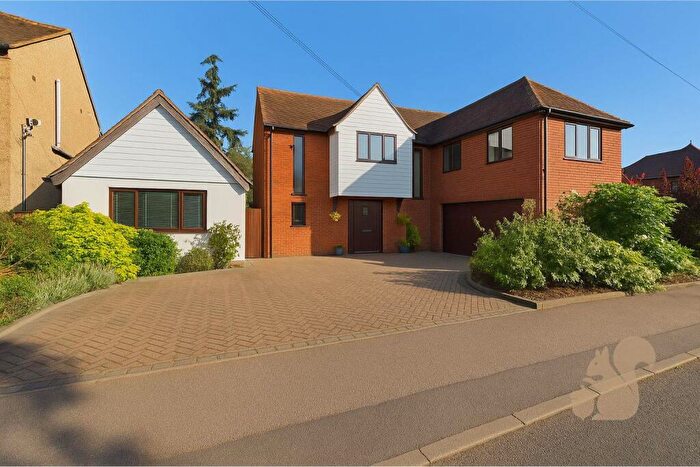
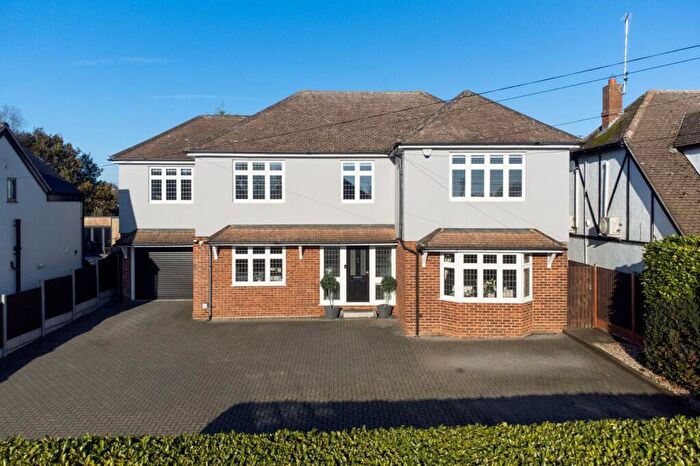
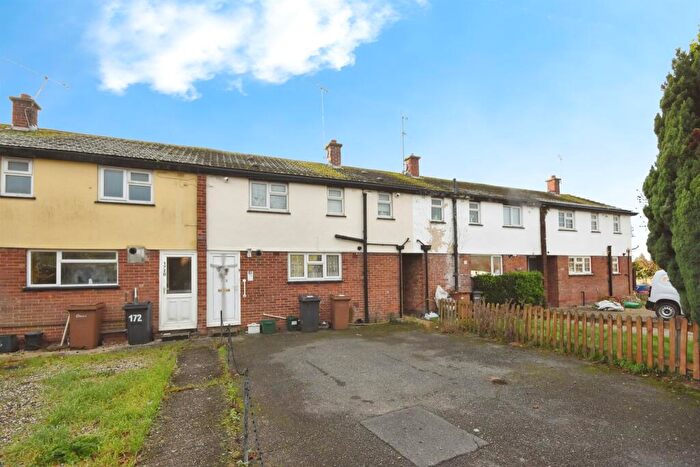
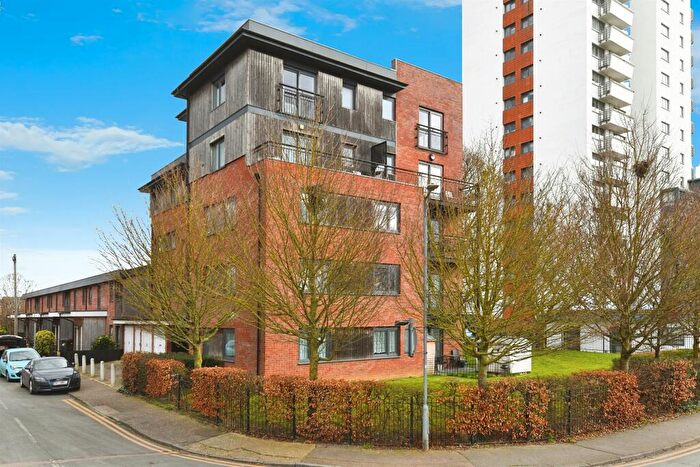
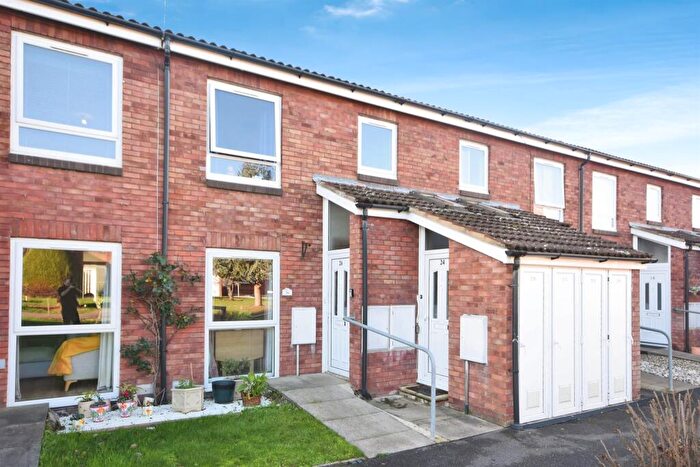
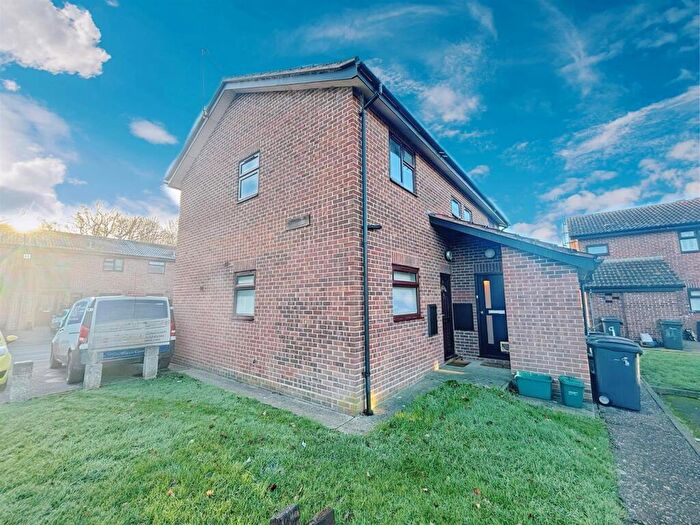
Properties for sale in St Andrews
Roads and Postcodes in St Andrews
Navigate through our locations to find the location of your next house in St Andrews, Chelmsford for sale or to rent.
| Streets | Postcodes |
|---|---|
| Acres End | CM1 2XR |
| Alamein Road | CM1 2EJ |
| Albany Close | CM1 2EP |
| Anderson Avenue | CM1 2BZ CM1 2DA |
| Arnhem Road | CM1 2EN |
| Auckland Close | CM1 2DJ |
| Avon Road | CM1 2JX CM1 2JY CM1 2JZ CM1 2LA CM1 2LB CM1 2LD |
| Barkis Close | CM1 4UW |
| Beachs Drive | CM1 2NJ CM1 2NL |
| Beaumont Walk | CM1 2HF |
| Belvawney Close | CM1 4YR |
| Canberra Close | CM1 2EF |
| Canterbury Way | CM1 2XN |
| Carstone Place | CM1 4YT |
| Cassino Road | CM1 2EW |
| Cherwell Drive | CM1 2JJ CM1 2JL |
| Cheviot Drive | CM1 2EU CM1 2EX |
| Chignal Road | CM1 2JA CM1 2JB CM1 2JD CM1 2JE CM1 2JR |
| Chiltern Close | CM1 2GJ |
| Chuzzlewit Drive | CM1 4XQ |
| Cliveden Close | CM1 2NP |
| Clyde Crescent | CM1 2LJ CM1 2LL |
| Cotswold Crescent | CM1 2HS |
| Cowell Avenue | CM1 2BY |
| Darnay Rise | CM1 4XA |
| Dene Court | CM1 2JQ |
| Derwent Way | CM1 2LP |
| Dickens Place | CM1 4UU CM1 4UX |
| Eden Way | CM1 2LF |
| Estella Mead | CM1 4XH |
| Fitzwalter Place | CM1 2LX |
| Foremans | CM1 2GQ |
| Fox Crescent | CM1 2BH CM1 2BN |
| Grampian Grove | CM1 2HJ |
| Havisham Way | CM1 4UY |
| Highfield Road | CM1 2NF CM1 2NG CM1 2NQ |
| Hobart Close | CM1 2ES CM1 2FN CM1 2FY |
| Homefield Close | CM1 2HE |
| Kennet Way | CM1 2JP |
| Landers Court | CM1 2XX |
| Langton Avenue | CM1 2BP CM1 2BS CM1 2BW |
| Lichfield Close | CM1 2XW |
| Madeline Place | CM1 4XD |
| Malvern Close | CM1 2HL |
| Medway Close | CM1 2LH |
| Melbourne Avenue | CM1 2DN CM1 2DP CM1 2DR CM1 2DT CM1 2DX CM1 2DU CM1 2DY |
| Melbourne Parade | CM1 2DW |
| Mendip Place | CM1 2WT |
| Mendip Road | CM1 2HN CM1 2HP CM1 2HW CM1 2HR |
| Mersey Way | CM1 2LE |
| Micawber Way | CM1 4UE CM1 4UG |
| Murchison Close | CM1 2ER |
| Napier Court | CM1 2ED |
| Nicholas Court | CM1 4XE |
| Nickleby Road | CM1 4UF CM1 4UL CM1 4XG CM1 4US CM1 4XB |
| Pan Walk | CM1 2HD |
| Pennine Road | CM1 2HG |
| Pickwick Avenue | CM1 4UN CM1 4UR |
| Pines Road | CM1 2DL CM1 2EY CM1 2EZ |
| Queensland Crescent | CM1 2DZ CM1 2EA CM1 2EB |
| Quinion Close | CM1 4UH |
| Roslings Close | CM1 2HA |
| Roxwell Avenue | CM1 2NR CM1 2NX |
| Roxwell Road | CM1 2LY CM1 2NB CM1 2ND CM1 2NE CM1 2NN CM1 2NT CM1 2PP |
| Sackville Close | CM1 2LU |
| Salerno Way | CM1 2EH |
| Scotts Walk | CM1 2HB |
| Skreens Court | CM1 2JF |
| Snowdon Close | CM1 2JS |
| Spalding Avenue | CM1 2BX |
| Spenlow Drive | CM1 4UQ |
| St Fabians Drive | CM1 2PR CM1 2PU |
| St James Park | CM1 2JG |
| St Nazaire Road | CM1 2EG CM1 2EQ |
| Steerforth Close | CM1 4UJ |
| Sunningdale Road | CM1 2NH |
| Tasman Court | CM1 2ET |
| Taylor Avenue | CM1 2BT CM1 2BU |
| Thames Avenue | CM1 2LN CM1 2LW |
| Tobruk Road | CM1 2EL |
| Trent Road | CM1 2LG CM1 2LQ CM1 2JH |
| Trotwood Close | CM1 4UZ |
| Tupman Close | CM1 4UP |
| Tyne Way | CM1 2LR |
| Wardle Way | CM1 4UB |
| Welland Avenue | CM1 2JN CM1 2JW |
| Wellington Close | CM1 2EE |
| Wickfield Ash | CM1 4UT |
| Wicklow Avenue | CM1 2HH CM1 2HQ |
| Windley Tye | CM1 2GR |
Transport near St Andrews
-
Chelmsford Station
-
Ingatestone Station
-
Hatfield Peverel Station
-
Billericay Station
-
White Notley Station
-
Cressing Station
-
Witham Station
-
Shenfield Station
-
South Woodham Ferrers Station
-
Wickford Station
- FAQ
- Price Paid By Year
- Property Type Price
Frequently asked questions about St Andrews
What is the average price for a property for sale in St Andrews?
The average price for a property for sale in St Andrews is £413,756. This amount is 3% lower than the average price in Chelmsford. There are 820 property listings for sale in St Andrews.
What streets have the most expensive properties for sale in St Andrews?
The streets with the most expensive properties for sale in St Andrews are Windley Tye at an average of £720,000, Acres End at an average of £707,016 and Highfield Road at an average of £693,888.
What streets have the most affordable properties for sale in St Andrews?
The streets with the most affordable properties for sale in St Andrews are Nicholas Court at an average of £101,875, Murchison Close at an average of £216,666 and Trent Road at an average of £227,666.
Which train stations are available in or near St Andrews?
Some of the train stations available in or near St Andrews are Chelmsford, Ingatestone and Hatfield Peverel.
Property Price Paid in St Andrews by Year
The average sold property price by year was:
| Year | Average Sold Price | Price Change |
Sold Properties
|
|---|---|---|---|
| 2025 | £454,475 | 14% |
56 Properties |
| 2024 | £390,171 | -4% |
103 Properties |
| 2023 | £404,739 | -4% |
78 Properties |
| 2022 | £420,468 | 14% |
127 Properties |
| 2021 | £362,264 | 1% |
138 Properties |
| 2020 | £358,858 | 6% |
78 Properties |
| 2019 | £337,957 | 2% |
104 Properties |
| 2018 | £330,438 | -4% |
103 Properties |
| 2017 | £342,667 | 11% |
119 Properties |
| 2016 | £304,678 | 11% |
145 Properties |
| 2015 | £270,460 | 7% |
135 Properties |
| 2014 | £250,416 | 7% |
116 Properties |
| 2013 | £233,290 | 8% |
131 Properties |
| 2012 | £215,473 | -11% |
98 Properties |
| 2011 | £239,909 | 11% |
99 Properties |
| 2010 | £213,095 | 9% |
102 Properties |
| 2009 | £193,792 | -10% |
77 Properties |
| 2008 | £213,320 | 3% |
82 Properties |
| 2007 | £207,493 | -1% |
195 Properties |
| 2006 | £210,470 | 10% |
171 Properties |
| 2005 | £188,766 | -3% |
101 Properties |
| 2004 | £193,516 | 8% |
160 Properties |
| 2003 | £177,961 | 9% |
145 Properties |
| 2002 | £161,794 | 21% |
178 Properties |
| 2001 | £127,968 | 18% |
170 Properties |
| 2000 | £104,689 | 12% |
135 Properties |
| 1999 | £91,834 | 15% |
152 Properties |
| 1998 | £78,452 | 4% |
110 Properties |
| 1997 | £74,967 | 12% |
143 Properties |
| 1996 | £66,073 | 4% |
146 Properties |
| 1995 | £63,346 | - |
113 Properties |
Property Price per Property Type in St Andrews
Here you can find historic sold price data in order to help with your property search.
The average Property Paid Price for specific property types in the last three years are:
| Property Type | Average Sold Price | Sold Properties |
|---|---|---|
| Semi Detached House | £404,727.00 | 124 Semi Detached Houses |
| Detached House | £610,842.00 | 99 Detached Houses |
| Terraced House | £336,714.00 | 87 Terraced Houses |
| Flat | £197,288.00 | 54 Flats |

