
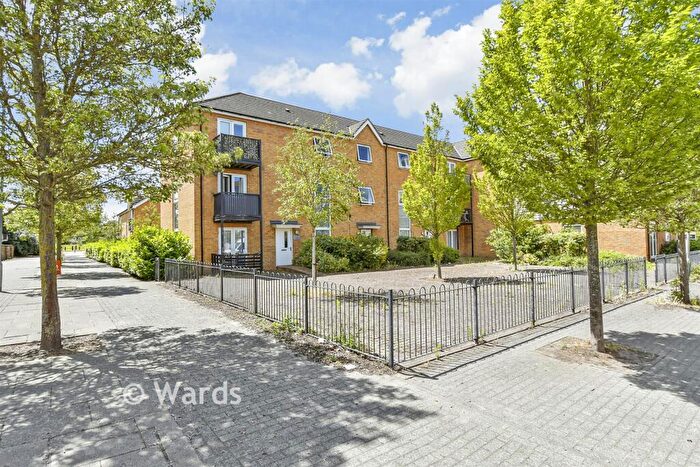
Houses for sale in Chalkwell, Sittingbourne
House Prices in Chalkwell
Properties in Chalkwell have an average house price of £269k and had 377 Property Transactions within the last 3 years¹.
Chalkwell is an area in Sittingbourne, Kent with 2,644 households², where the most expensive property was sold for £577k.
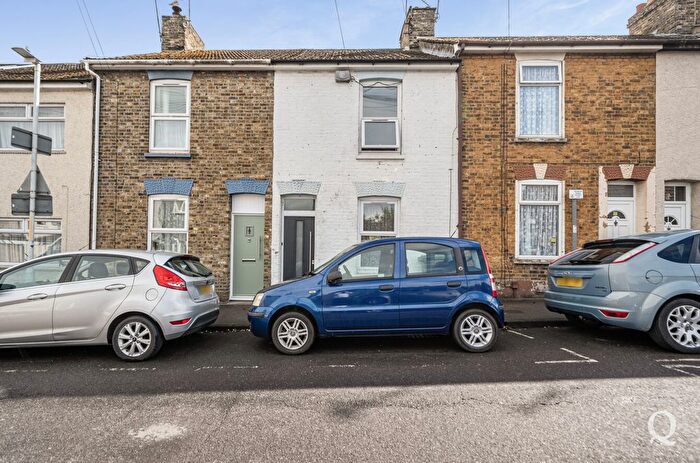
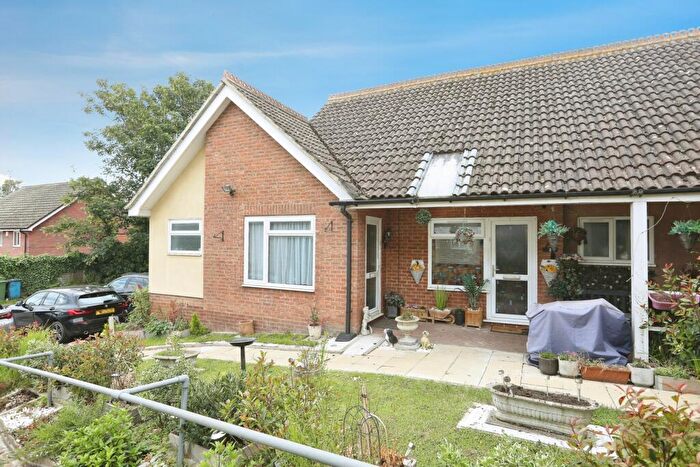
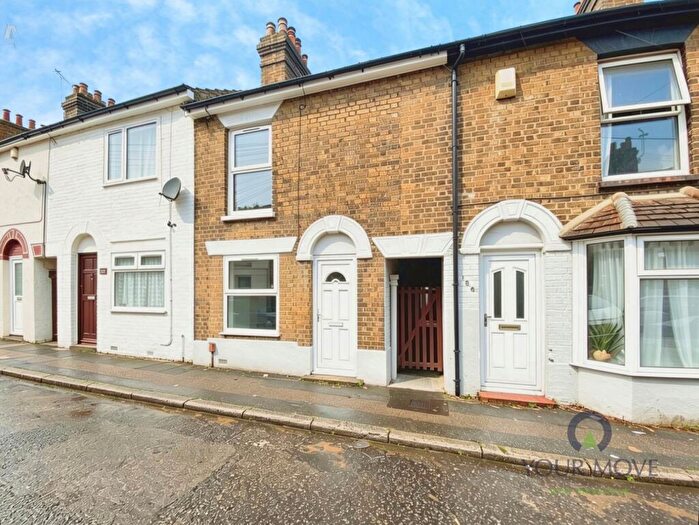
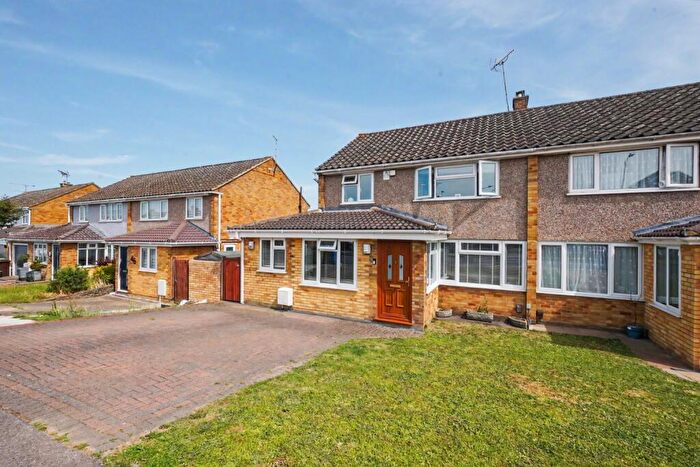
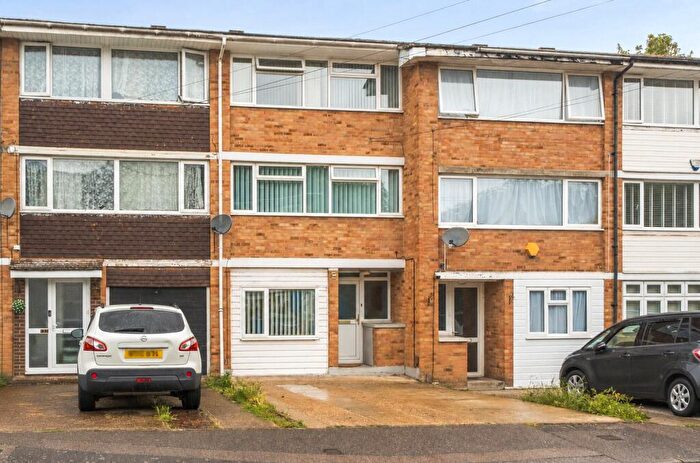
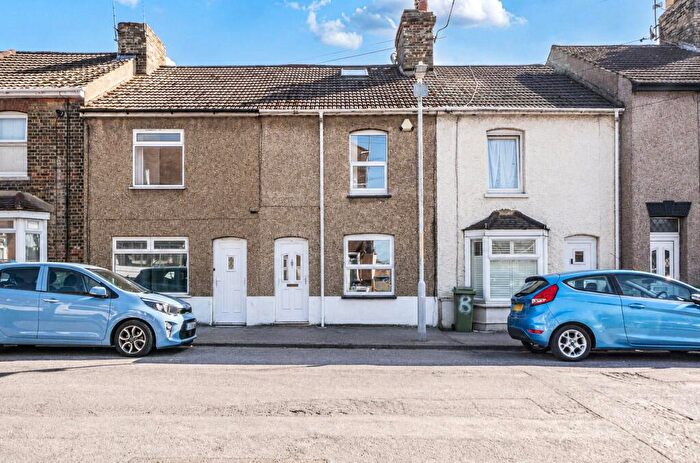
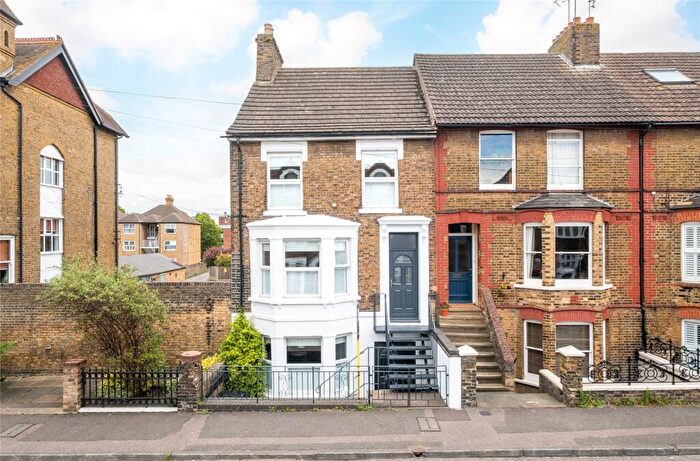
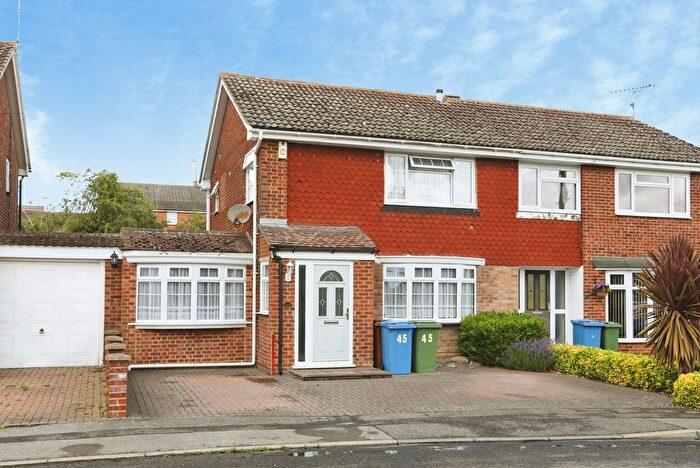
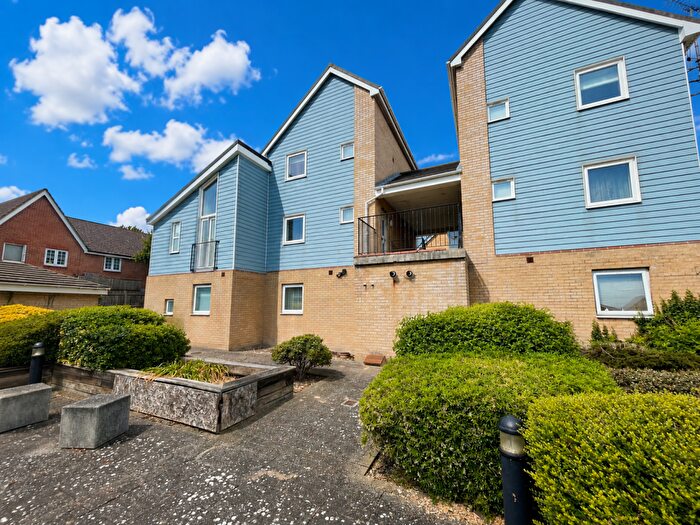
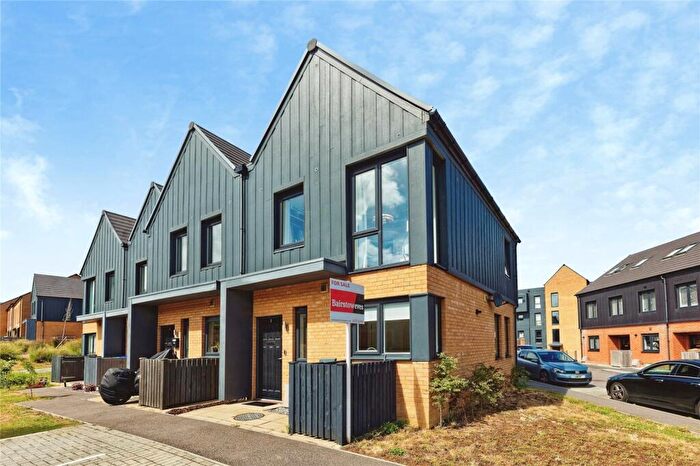
Properties for sale in Chalkwell
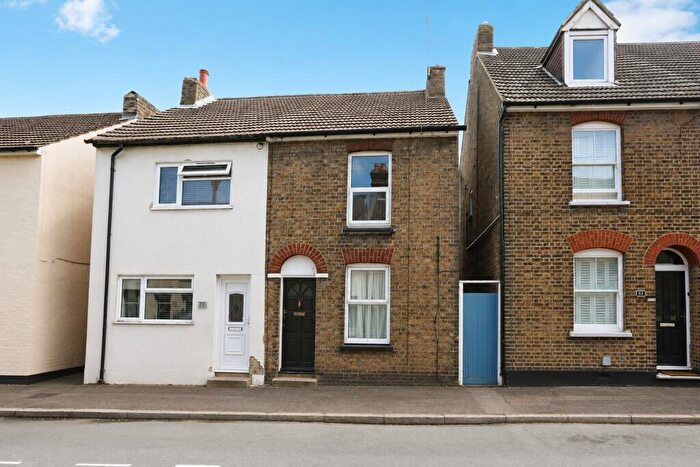
![]()
If you are looking to sell your house, let it out, or receive a property valuation, an expert can help you.
Click the button below to get started.


Roads and Postcodes in Chalkwell
Navigate through our locations to find the location of your next house in Chalkwell, Sittingbourne for sale or to rent.
| Streets | Postcodes |
|---|---|
| Addington Road | ME10 1HT |
| Alexander Court | ME10 2LY |
| Anselm Close | ME10 1EY |
| Arthur Street | ME10 1BA |
| Balmoral Terrace | ME10 1NN |
| Barkers Court | ME10 1LR ME10 1LW |
| Barrow Grove | ME10 1LA ME10 1LB |
| Bassett Road | ME10 1JR |
| Bell Shopping Centre | ME10 4DW |
| Borden Lane | ME10 1BT ME10 1BU ME10 1BX ME10 1DB ME10 1DD ME10 1DH |
| Bowater Close | ME10 2FR |
| Burley Road | ME10 1JH ME10 1JJ ME10 1NP |
| Caithorpe Close | ME10 3GY ME10 3GZ |
| Cambria Crescent | ME10 3GT |
| Cambria Walk | ME10 2FW |
| Chalkwell Road | ME10 2LE ME10 1BH ME10 1BJ ME10 1BQ ME10 2LD ME10 2LG ME10 2LJ ME10 2LP |
| Charlotte Street | ME10 2JN ME10 2JX |
| Church Street | ME10 2JY ME10 2WS ME10 2GX ME10 2JZ ME10 3EG |
| Cloisters | ME10 1AF |
| College Road | ME10 1LL ME10 1LN |
| Connaught Road | ME10 1HY |
| Copper Beech Close | ME10 1FE |
| Crown Quay Lane | ME10 3HU ME10 3HY |
| Dover Street | ME10 3EL |
| Eastwood Road | ME10 2LZ ME10 2NA |
| Epps Road | ME10 1JD |
| Eurolink Way | ME10 3HH |
| Frederick Street | ME10 1AU ME10 1BG |
| Gibson Street | ME10 1AY ME10 1BE |
| Haddon Close | ME10 2FS |
| Hawthorn Road | ME10 1AT ME10 1BB ME10 1BD ME10 1BF |
| Hedley Walk | ME10 2FX |
| High Street | ME10 4AL ME10 4AQ ME10 4AU ME10 4BD ME10 4PE ME10 4PG ME10 4PP ME10 4AP ME10 4AY ME10 4PH |
| Homewood Avenue | ME10 1XL ME10 1XW |
| Hythe Road | ME10 2LR ME10 2LS ME10 2LW |
| Johnson Road | ME10 1JS |
| Laburnum Place | ME10 1AX |
| London Road | ME10 1ND ME10 1NA ME10 1NF ME10 1NJ ME10 1NL ME10 1NQ |
| Lywood Drive | ME10 2FT |
| Manor Grove | ME10 1LS ME10 1LT |
| Medway Close | ME10 1LP |
| Mill Way | ME10 2GZ ME10 3ET |
| Millen Road | ME10 2BQ |
| Milton Road | ME10 3EX |
| Nativity Close | ME10 1ET |
| Parrett Avenue | ME10 3GS |
| Pembury Court | ME10 3EF |
| Periwinkle Close | ME10 2JT ME10 2JU |
| Rapson End | ME10 3GX ME10 3LW |
| Redgrove Avenue | ME10 2FQ |
| Regency Court | ME10 1BZ |
| Robertson Drive | ME10 3GU |
| Rock Road | ME10 1JF ME10 1JG |
| Romney Court | ME10 2LH |
| Seddingbourne Way | ME10 3HA ME10 3HF |
| Sittingbourne Retail Park | ME10 2XD |
| Spring Wood Park | ME10 2FN |
| Springfield Road | ME10 2NB ME10 2ND |
| St Michaels Road | ME10 3DW ME10 3JY |
| Staplehurst Road | ME10 2NH ME10 2LX ME10 2NN ME10 2NW ME10 2NY |
| Station Street | ME10 3ED ME10 3LF |
| Tavistock Close | ME10 1JY |
| The Forum | ME10 3DL |
| Tylden Gardens | ME10 3GP |
| Ufton Lane | ME10 1HJ ME10 1JA ME10 1JB ME10 1JW |
| Unity Street | ME10 1HX |
| Victoria Road | ME10 1BS |
| Victoria Terrace | ME10 1JT |
| Walmer Gardens | ME10 2LT |
| Waterloo Road | ME10 2LN |
| Watsons Hill | ME10 2JR ME10 2JS ME10 2JW |
| Wellwinch Road | ME10 1BW |
| West Street | ME10 1AS ME10 1AA ME10 1AJ ME10 1AL ME10 1AN ME10 1AR |
| William Street | ME10 1HR ME10 1HS |
| ME10 3HN ME10 2FU ME10 3GW |
Property price trends in Chalkwell
According to the latest Land Registry data, the average home in Chalkwell sold for £292,250 in 2026. That figure comes from 4,100 sales logged over the past 31 years.
Prices have moved up over the last three years. Compared with 2023, when the typical sale came in around £276,195, that's a rise of roughly 5.8%.
Looking back five years, average prices are up about 29.1% since 2021, a gain of around £65,871 in cash terms.
Zoom out to the past decade for the fuller picture. Back in 2016, homes here averaged £184,707, so the typical sold price has climbed about 58.2% since then, roughly 4.7% a year. Stretch the view to fifteen years and that annual pace edges up closer to 5.8%.
Frequently asked questions about Chalkwell
What is the average price for a property for sale in Chalkwell?
The average price for a property for sale in Chalkwell is £268,759. This amount is 15% lower than the average price in Sittingbourne. There are 2,298 property listings for sale in Chalkwell.
What streets have the most expensive properties for sale in Chalkwell?
The streets with the most expensive properties for sale in Chalkwell are Copper Beech Close at an average of £520,000, Tylden Gardens at an average of £440,583 and Robertson Drive at an average of £386,000.
What streets have the most affordable properties for sale in Chalkwell?
The streets with the most affordable properties for sale in Chalkwell are Cloisters at an average of £129,000, Barkers Court at an average of £137,470 and Church Street at an average of £188,558.
Which train stations are available in or near Chalkwell?
Some of the train stations available in or near Chalkwell are Sittingbourne, Kemsley and Newington.
Property Price Paid in Chalkwell by Year
The average sold property price by year was:
| Year | Average Sold Price | Price Change |
Sold Properties
|
|---|---|---|---|
| 2026 | £292,250 | 12% |
8 Properties |
| 2025 | £256,486 | -7% |
140 Properties |
| 2024 | £274,890 | -0,5% |
132 Properties |
| 2023 | £276,195 | -1% |
97 Properties |
| 2022 | £278,885 | 19% |
146 Properties |
| 2021 | £226,379 | 1% |
132 Properties |
| 2020 | £225,047 | -8% |
174 Properties |
| 2019 | £243,847 | 12% |
216 Properties |
| 2018 | £213,465 | -41% |
127 Properties |
| 2017 | £302,037 | 39% |
113 Properties |
Property Price per Property Type in Chalkwell
Here you can find historic sold price data in order to help with your property search.
The average Property Paid Price for specific property types in the last three years are:
| Property Type | Average Sold Price | Sold Properties |
|---|---|---|
| Semi Detached House | £323,917.00 | 67 Semi Detached Houses |
| Detached House | £432,331.00 | 33 Detached Houses |
| Terraced House | £262,445.00 | 201 Terraced Houses |
| Flat | £165,809.00 | 76 Flats |
