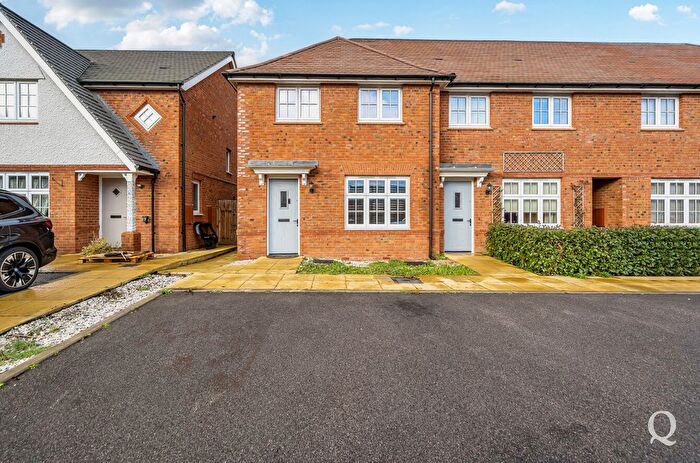
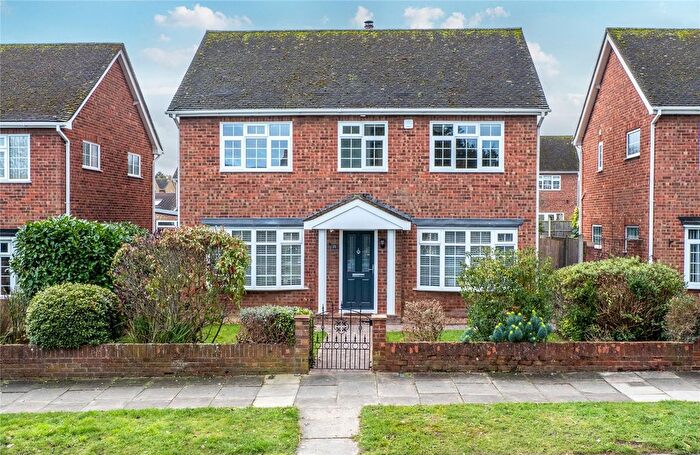
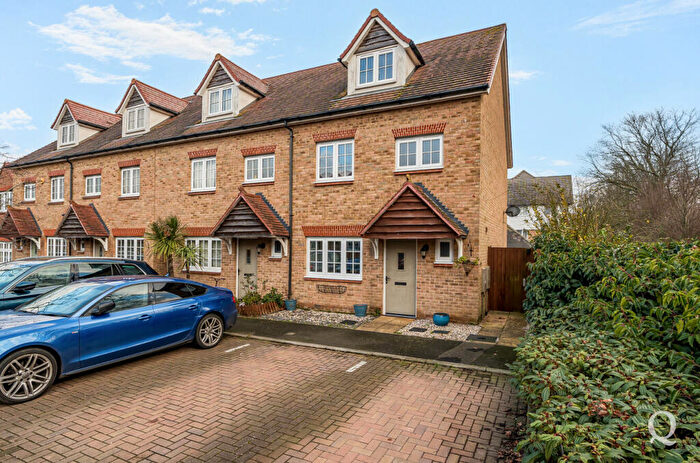
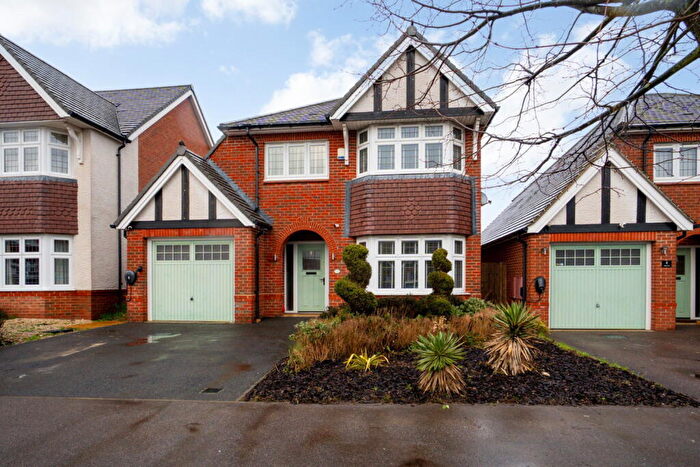
Houses for sale & to rent in Grove, Sittingbourne
House Prices in Grove
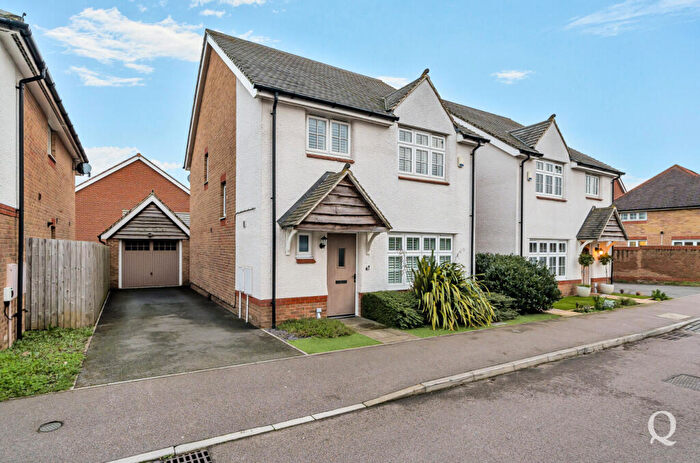
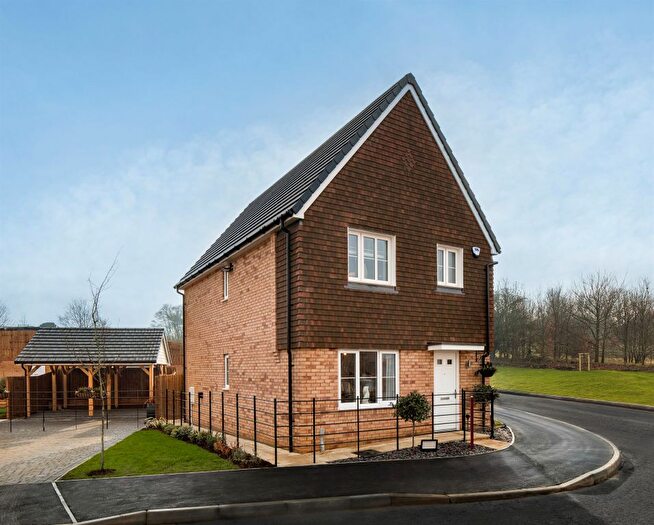
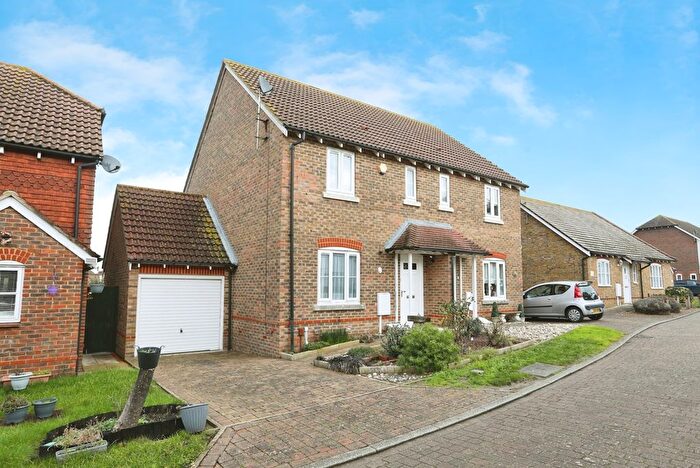
Properties in Grove have an average house price of £311,824.00 and had 310 Property Transactions within the last 3 years¹.
Grove is an area in Sittingbourne, Kent with 2,669 households², where the most expensive property was sold for £906,000.00.
Properties for sale in Grove
Roads and Postcodes in Grove
Navigate through our locations to find the location of your next house in Grove, Sittingbourne for sale or to rent.
| Streets | Postcodes |
|---|---|
| Adelaide Drive | ME10 1XU ME10 1YB ME10 1YE |
| Agate Court | ME10 5LF |
| Allenby Walk | ME10 1LX |
| Amber Rise | ME10 5JE |
| Amethyst Drive | ME10 5JR ME10 5JS ME10 5LE |
| Anatase Close | ME10 5AN |
| Andrews Walk | ME10 1QU |
| Argent Way | ME10 5AR ME10 5JX ME10 5NF ME10 5NZ |
| Ashington Close | ME10 1EJ |
| Balas Drive | ME10 5AS ME10 5BA |
| Belnor Avenue | ME9 8QB |
| Bismuth Drive | ME10 5JT ME10 5JU |
| Bobbing Hill | ME9 8NY ME9 8PA ME9 8PB |
| Bourne Grove | ME10 1SZ |
| Brisbane Avenue | ME10 1XZ |
| Cambray Farm Cottages | ME9 8QL |
| Canberra Gardens | ME10 1YA |
| Chatsworth Drive | ME10 1TW |
| Cinnabar Drive | ME10 5LA |
| Clive Road | ME10 1PJ ME10 1PL ME10 1QQ |
| Coldharbour Lane | ME9 8NN |
| Collingwood Walk | ME10 1LY |
| Cryalls Lane | ME10 1NU ME10 1NY ME10 1NZ |
| Emerald Crescent | ME10 5JJ ME10 5JL ME10 5JQ |
| Feldspar Close | ME10 5FE |
| Fire Opal Way | ME10 5JW |
| Gadby Road | ME10 1PY ME10 1TD ME10 1TF ME10 1TJ ME10 1TL ME10 1TQ |
| Gainsborough Close | ME10 1TP |
| Galena Close | ME10 5GA ME10 5LB |
| Gayhurst Drive | ME10 1UD ME10 1UE |
| Gibbons Road | ME10 1PS |
| Helidor Walk | ME10 5AF |
| Hilton Drive | ME10 1PT ME10 1PU ME10 1QG |
| Hobart Gardens | ME10 1YD |
| Jacinth Drive | ME10 5AP ME10 5BP ME10 5JA |
| Jade Close | ME10 5AZ |
| Kenilworth Court | ME10 1TX ME10 1TY ME10 1TZ |
| Key Street | ME10 1YX |
| Keycol Hill | ME9 8LZ ME9 8ND ME9 8NQ |
| Ladyfields Close | ME9 8TA |
| London Road | ME10 1NR ME10 1NS ME10 1PA ME10 1QA ME10 1QB |
| Lonsdale Drive | ME10 1TS ME10 1TT |
| Lorimar Court | ME10 5JB ME10 5JD |
| Lydbrook Close | ME10 1NW |
| Meads Avenue | ME10 2BT |
| Moonstone Square | ME10 5JN |
| Nelson Walk | ME10 1LZ |
| Newlands Avenue | ME10 1PH |
| Norwood Walk | ME10 1QE ME10 1QF |
| Old Maidstone Road | ME9 8BS |
| Olivine Close | ME10 5NE |
| Onyx Drive | ME10 5LG |
| Parsonage Lane | ME9 8PZ ME9 8QA |
| Pearl Walk | ME10 5AG |
| Peridot Walk | ME10 5AE |
| Perth Gardens | ME10 1XY |
| Pheasants Cottages | ME9 8QX |
| Prentis Close | ME10 1TE |
| Quartz Way | ME10 5AA ME10 5AB |
| Quinton Road | ME10 2BP ME10 2DB ME10 2DD |
| Raite Green | ME10 5JY |
| Realgar Court | ME10 5JZ |
| Rolvenden Drive | ME10 1TR |
| Rooks View | ME9 8GB |
| Ruby Close | ME10 5JP |
| Sandford Road | ME10 1PP ME10 1PR ME10 1PX |
| Sapphire Close | ME10 5JG |
| Sheppey Way | ME9 8PJ ME9 8PL ME9 8PN ME9 8PP ME9 8QN ME9 8QP ME9 8QS |
| Simpson Road | ME10 1QD |
| Somerset Close | ME10 1JU |
| Sonora Way | ME10 5JH ME10 5NA ME10 5SN |
| Spinel Close | ME10 5AH ME10 5AL |
| Staplehurst Road | ME10 1SY |
| Sunstone Drive | ME10 5JF |
| Sydney Avenue | ME10 1XX |
| Topaz Drive | ME10 5TP |
| Tourmaline Drive | ME10 5TA |
| Trona Court | ME10 5LD |
| Walnut Tree Drive | ME10 1JZ |
| Warwick Crescent | ME10 1TG |
| Wellington Road | ME10 1LU |
| Wentworth Drive | ME10 1TU ME10 1UB |
| Westlands Avenue | ME10 1PG |
| Wilton Terrace | ME10 1QR |
| Woollett Road | ME10 1PZ |
Transport near Grove
- FAQ
- Price Paid By Year
- Property Type Price
Frequently asked questions about Grove
What is the average price for a property for sale in Grove?
The average price for a property for sale in Grove is £311,824. This amount is 1% lower than the average price in Sittingbourne. There are 3,907 property listings for sale in Grove.
What streets have the most expensive properties for sale in Grove?
The streets with the most expensive properties for sale in Grove are Rooks View at an average of £648,000, Sheppey Way at an average of £566,667 and Sunstone Drive at an average of £515,000.
What streets have the most affordable properties for sale in Grove?
The streets with the most affordable properties for sale in Grove are Onyx Drive at an average of £133,437, Raite Green at an average of £135,000 and Meads Avenue at an average of £150,000.
Which train stations are available in or near Grove?
Some of the train stations available in or near Grove are Sittingbourne, Kemsley and Newington.
Property Price Paid in Grove by Year
The average sold property price by year was:
| Year | Average Sold Price | Price Change |
Sold Properties
|
|---|---|---|---|
| 2025 | £316,985 | 2% |
102 Properties |
| 2024 | £310,247 | 1% |
97 Properties |
| 2023 | £308,460 | -5% |
111 Properties |
| 2022 | £322,573 | 12% |
136 Properties |
| 2021 | £283,773 | 7% |
182 Properties |
| 2020 | £262,601 | 8% |
128 Properties |
| 2019 | £242,733 | -3% |
119 Properties |
| 2018 | £249,450 | -7% |
119 Properties |
| 2017 | £266,096 | 11% |
145 Properties |
| 2016 | £235,596 | 10% |
145 Properties |
| 2015 | £211,177 | 7% |
160 Properties |
| 2014 | £196,082 | -0,4% |
174 Properties |
| 2013 | £196,885 | 11% |
130 Properties |
| 2012 | £174,903 | 3% |
134 Properties |
| 2011 | £169,900 | -1% |
87 Properties |
| 2010 | £172,357 | 0,4% |
100 Properties |
| 2009 | £171,628 | -12% |
78 Properties |
| 2008 | £191,614 | 17% |
102 Properties |
| 2007 | £159,066 | -18% |
311 Properties |
| 2006 | £188,473 | 1% |
270 Properties |
| 2005 | £187,331 | 9% |
196 Properties |
| 2004 | £171,053 | 12% |
251 Properties |
| 2003 | £149,787 | 8% |
196 Properties |
| 2002 | £137,481 | 14% |
220 Properties |
| 2001 | £118,465 | 5% |
286 Properties |
| 2000 | £112,352 | 20% |
207 Properties |
| 1999 | £89,440 | 13% |
144 Properties |
| 1998 | £77,440 | 5% |
77 Properties |
| 1997 | £73,586 | 17% |
70 Properties |
| 1996 | £60,769 | 7% |
86 Properties |
| 1995 | £56,660 | - |
73 Properties |
Property Price per Property Type in Grove
Here you can find historic sold price data in order to help with your property search.
The average Property Paid Price for specific property types in the last three years are:
| Property Type | Average Sold Price | Sold Properties |
|---|---|---|
| Semi Detached House | £323,520.00 | 117 Semi Detached Houses |
| Detached House | £446,155.00 | 62 Detached Houses |
| Terraced House | £275,509.00 | 90 Terraced Houses |
| Flat | £155,031.00 | 41 Flats |

