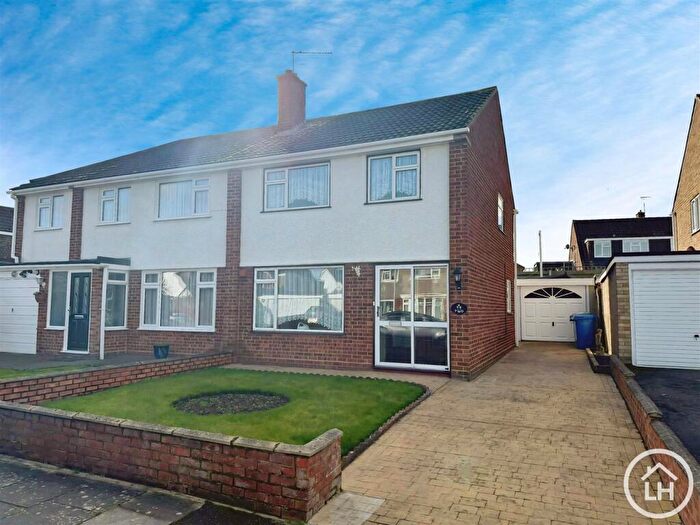
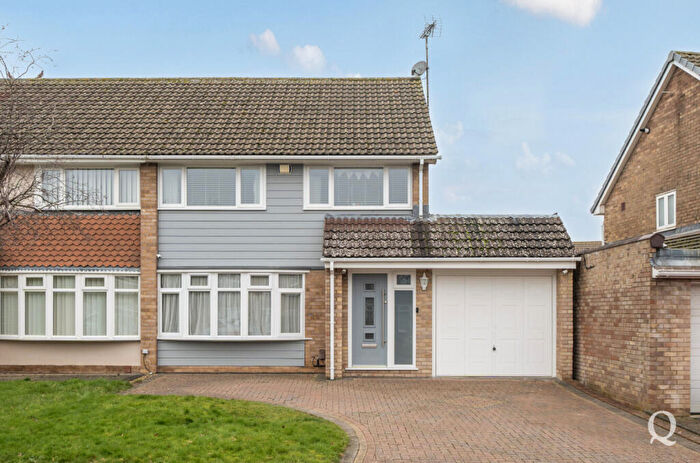
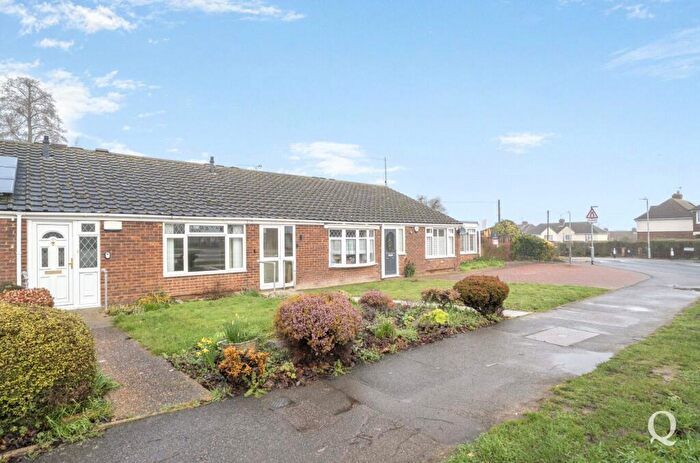
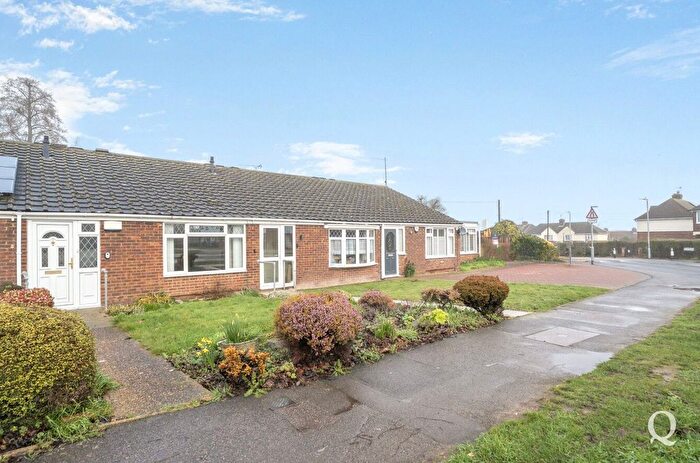
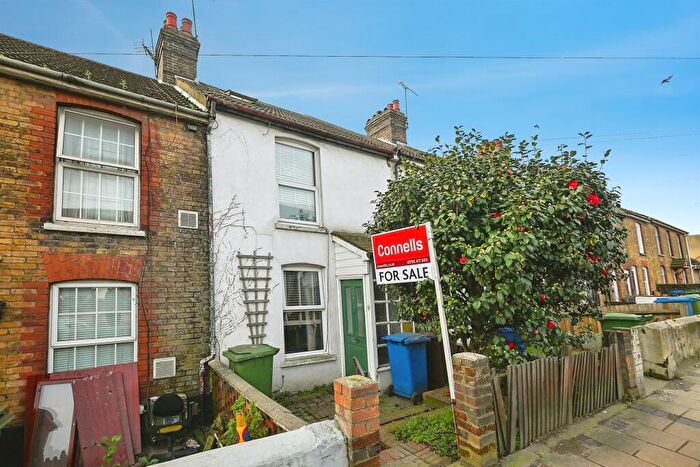
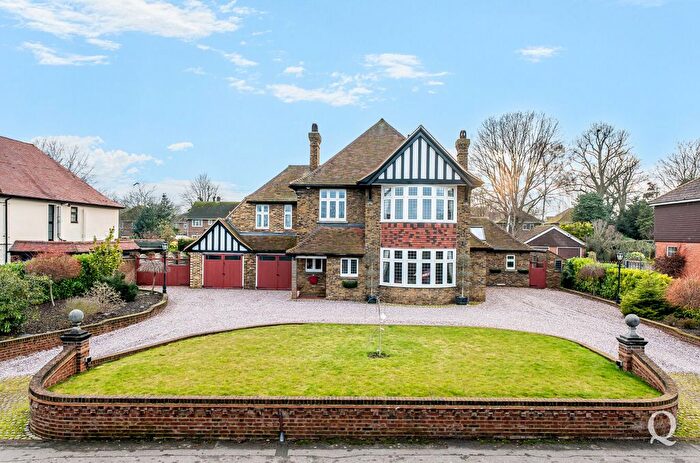
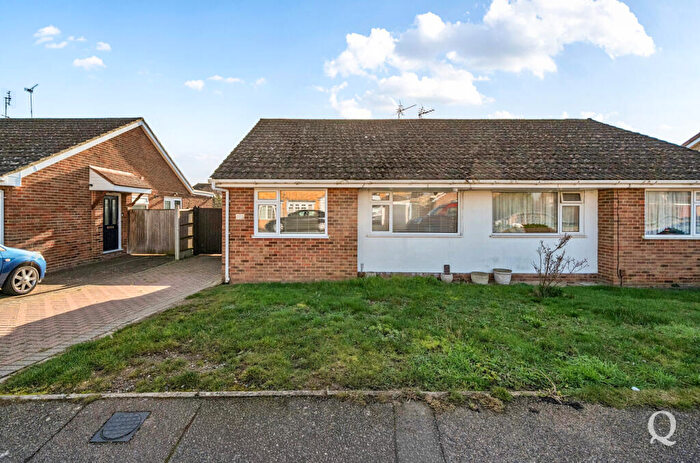
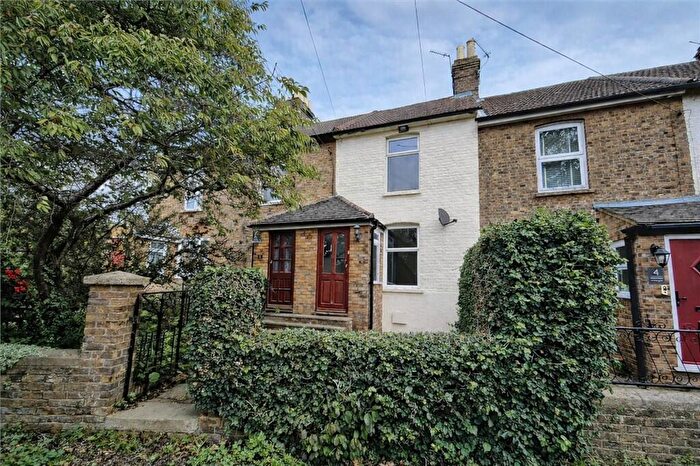
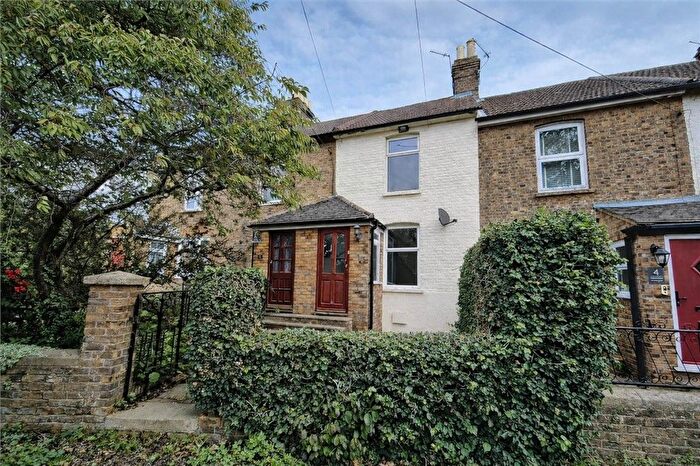
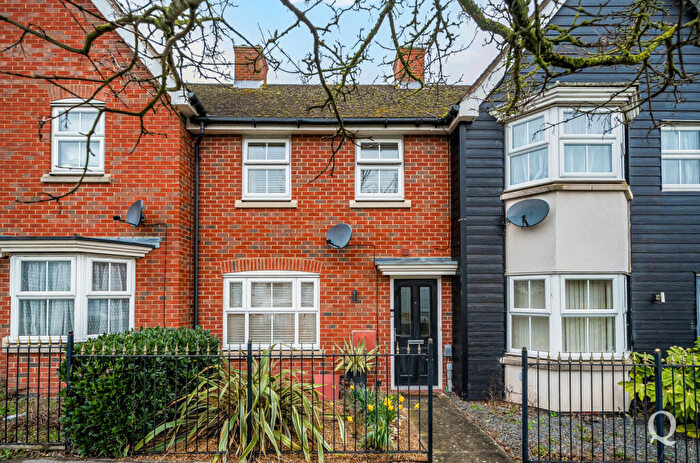
Houses for sale & to rent in Sittingbourne, Kent
House Prices in Sittingbourne
Properties in Sittingbourne have an average house price of £315,815.00 and had 2,901 Property Transactions within the last 3 years.¹
Sittingbourne is an area in Kent with 27,624 households², where the most expensive property was sold for £3,940,000.00.
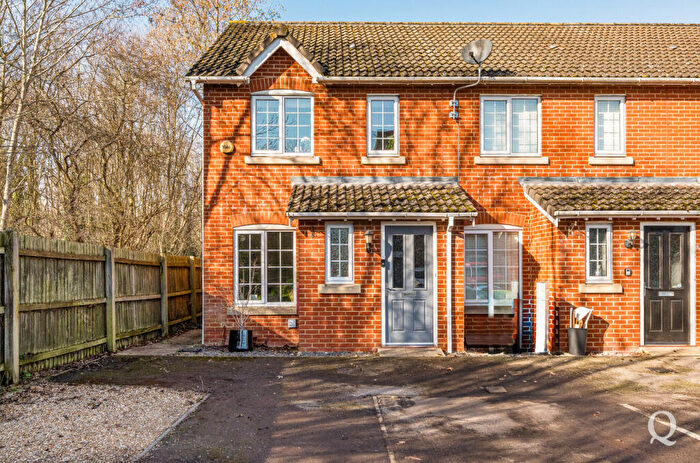
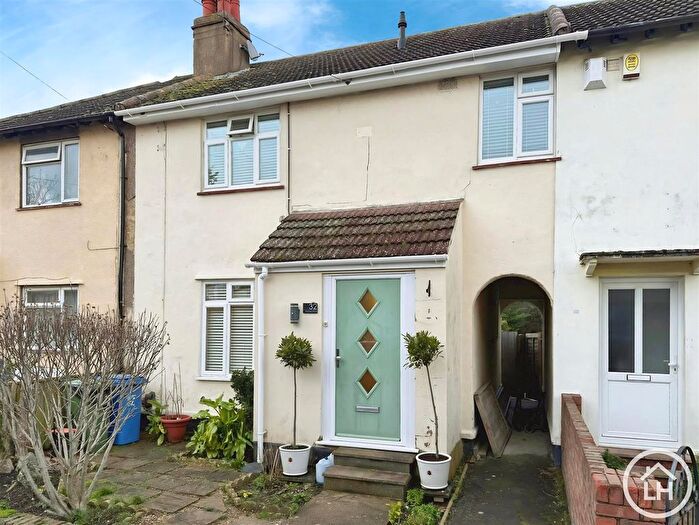
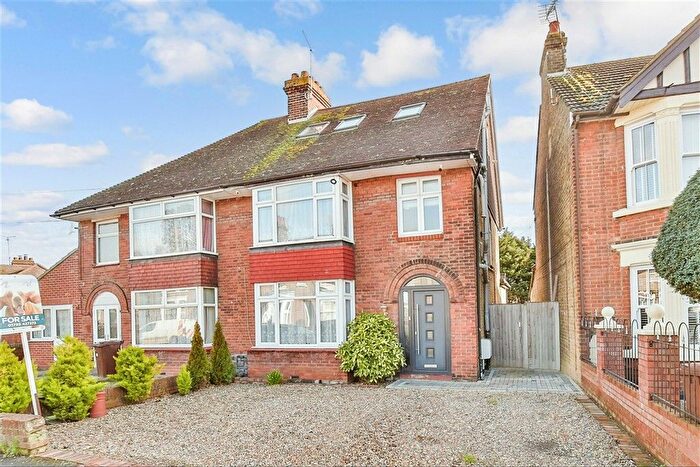
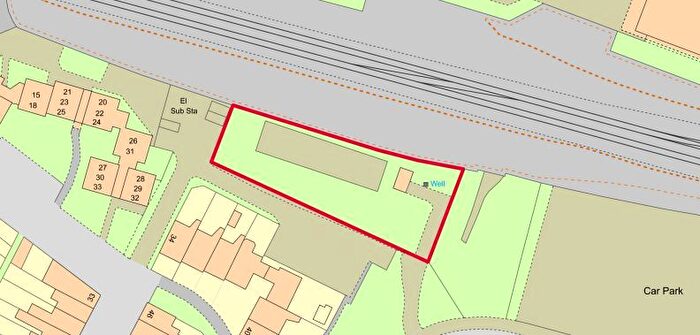
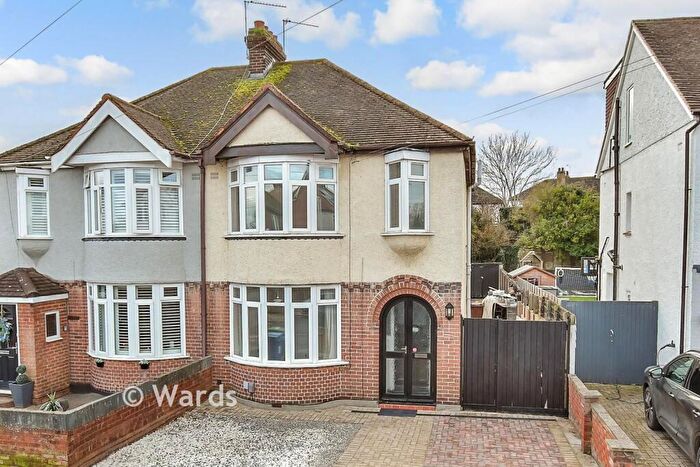
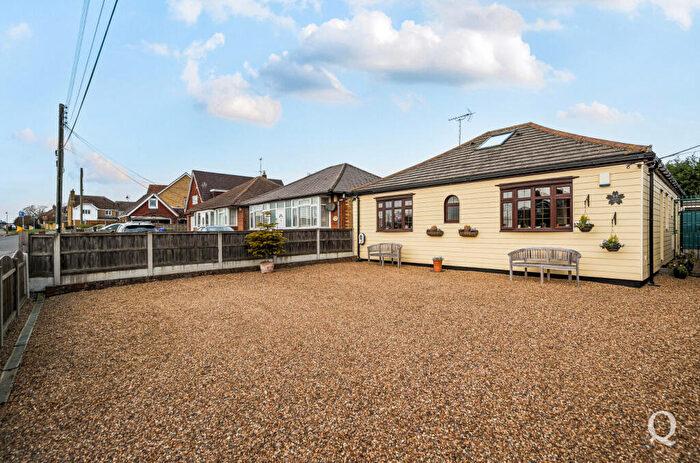
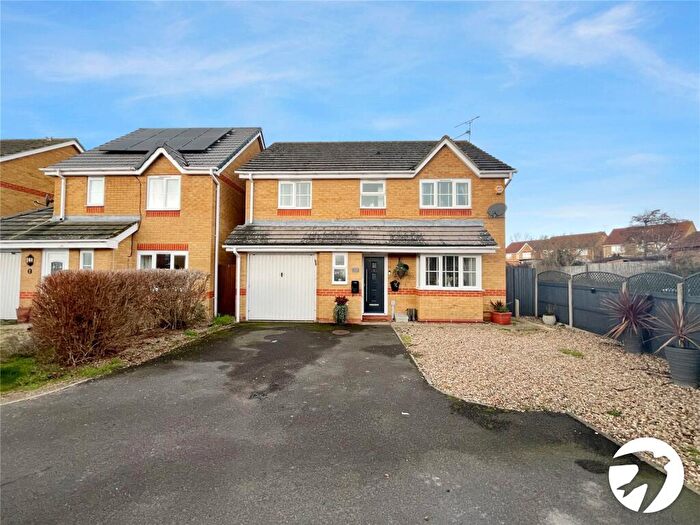
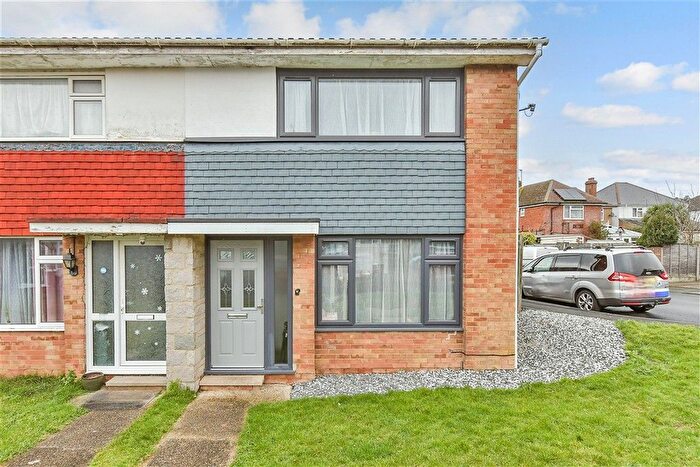
Properties for sale in Sittingbourne
Neighbourhoods in Sittingbourne
Navigate through our locations to find the location of your next house in Sittingbourne, Kent for sale or to rent.
Transport in Sittingbourne
Please see below transportation links in this area:
- FAQ
- Price Paid By Year
- Property Type Price
Frequently asked questions about Sittingbourne
What is the average price for a property for sale in Sittingbourne?
The average price for a property for sale in Sittingbourne is £315,815. This amount is 19% lower than the average price in Kent. There are more than 10,000 property listings for sale in Sittingbourne.
What locations have the most expensive properties for sale in Sittingbourne?
The locations with the most expensive properties for sale in Sittingbourne are North Downs at an average of £708,025, West Downs at an average of £480,720 and East Downs at an average of £458,737.
What locations have the most affordable properties for sale in Sittingbourne?
The locations with the most affordable properties for sale in Sittingbourne are Borden and Grove Park at an average of £166,750, Roman at an average of £251,657 and Murston at an average of £258,497.
Which train stations are available in or near Sittingbourne?
Some of the train stations available in or near Sittingbourne are Sittingbourne, Kemsley and Newington.
Property Price Paid in Sittingbourne by Year
The average sold property price by year was:
| Year | Average Sold Price | Price Change |
Sold Properties
|
|---|---|---|---|
| 2025 | £314,904 | - |
919 Properties |
| 2024 | £314,986 | -1% |
1,113 Properties |
| 2023 | £317,839 | -5% |
869 Properties |
| 2022 | £333,536 | 9% |
1,201 Properties |
| 2021 | £303,049 | 7% |
1,529 Properties |
| 2020 | £283,128 | 4% |
1,155 Properties |
| 2019 | £271,311 | -0,4% |
1,276 Properties |
| 2018 | £272,291 | -0,4% |
1,276 Properties |
| 2017 | £273,307 | 10% |
1,360 Properties |
| 2016 | £246,320 | 11% |
1,494 Properties |
| 2015 | £218,372 | 8% |
1,391 Properties |
| 2014 | £200,551 | 4% |
1,384 Properties |
| 2013 | £192,049 | 5% |
1,037 Properties |
| 2012 | £183,284 | 1% |
916 Properties |
| 2011 | £181,421 | -2% |
836 Properties |
| 2010 | £184,195 | 4% |
871 Properties |
| 2009 | £176,554 | -7% |
738 Properties |
| 2008 | £188,753 | 2% |
803 Properties |
| 2007 | £185,761 | 0,5% |
1,923 Properties |
| 2006 | £184,839 | 4% |
1,957 Properties |
| 2005 | £177,026 | 5% |
1,432 Properties |
| 2004 | £167,969 | 11% |
1,741 Properties |
| 2003 | £148,788 | 12% |
1,663 Properties |
| 2002 | £130,292 | 16% |
1,860 Properties |
| 2001 | £109,067 | 10% |
1,754 Properties |
| 2000 | £98,221 | 17% |
1,643 Properties |
| 1999 | £81,714 | 12% |
1,499 Properties |
| 1998 | £71,585 | 6% |
1,300 Properties |
| 1997 | £67,010 | 8% |
1,269 Properties |
| 1996 | £61,377 | 4% |
1,035 Properties |
| 1995 | £58,912 | - |
976 Properties |
Property Price per Property Type in Sittingbourne
Here you can find historic sold price data in order to help with your property search.
The average Property Paid Price for specific property types in the last three years are:
| Property Type | Average Sold Price | Sold Properties |
|---|---|---|
| Semi Detached House | £326,198.00 | 951 Semi Detached Houses |
| Terraced House | £264,369.00 | 1,055 Terraced Houses |
| Detached House | £492,995.00 | 547 Detached Houses |
| Flat | £164,905.00 | 348 Flats |

