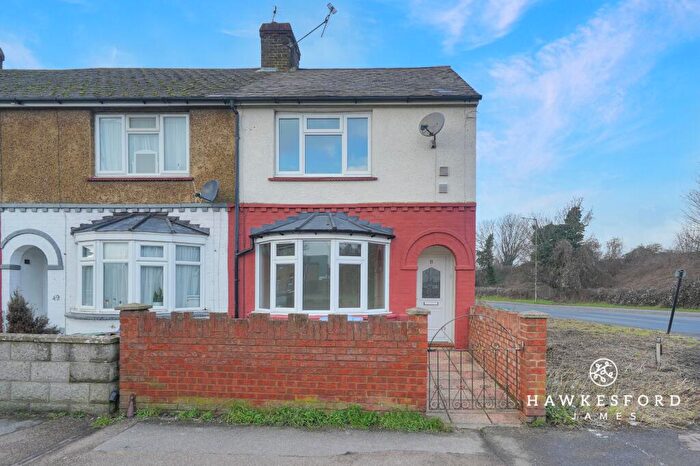
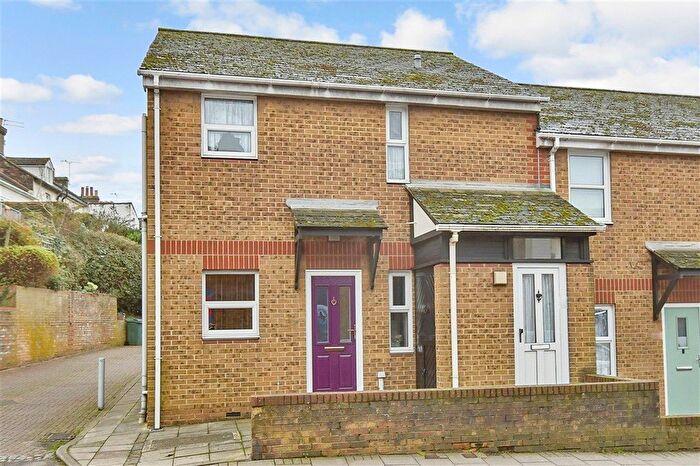
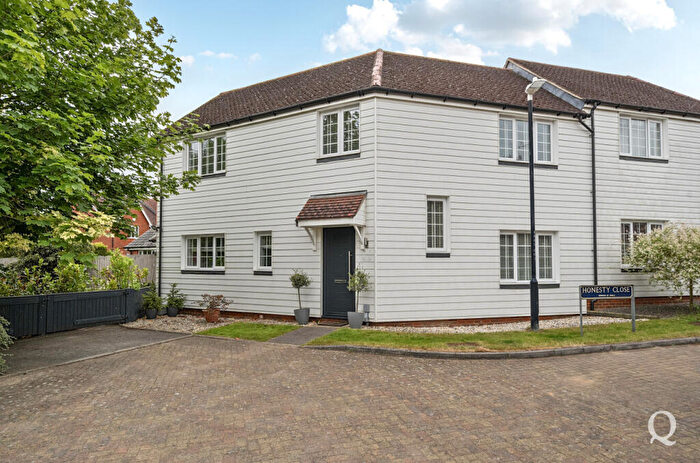
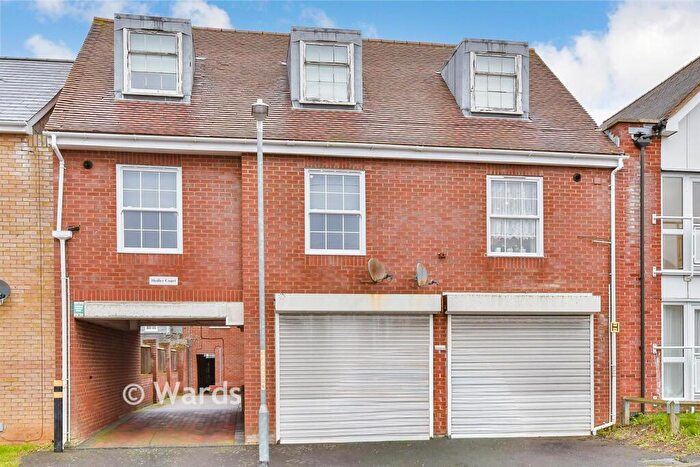
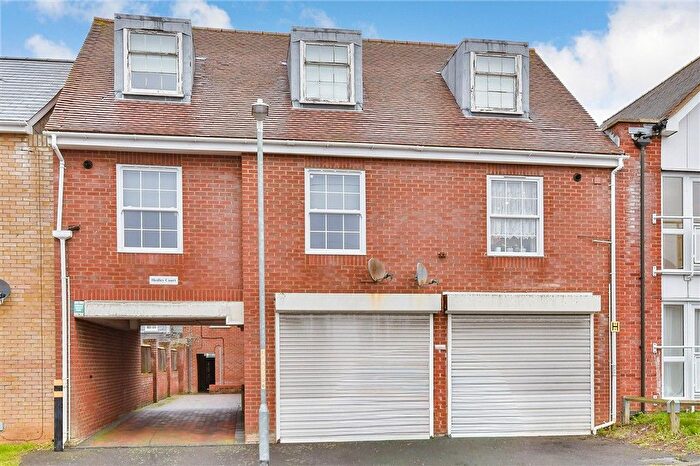
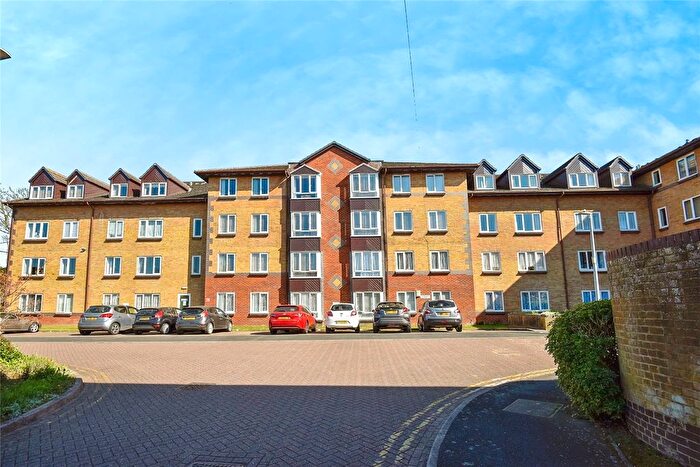
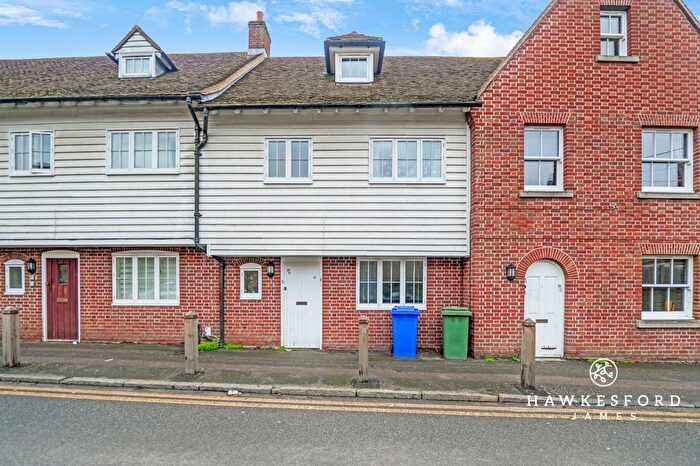
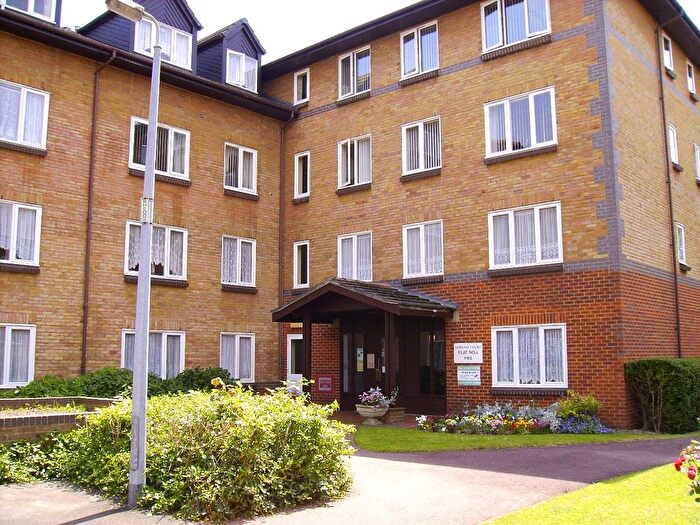
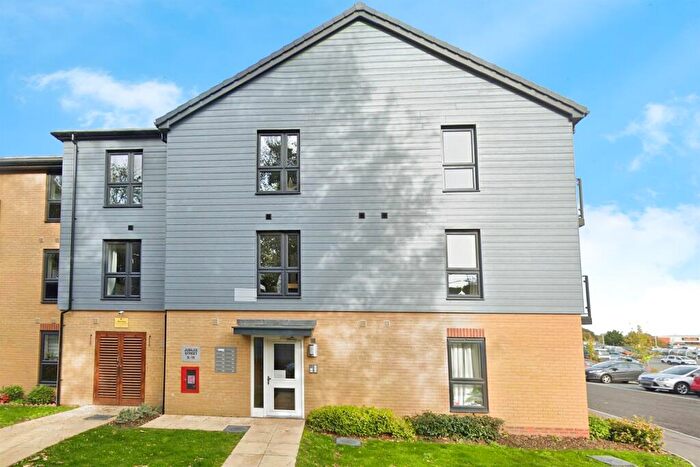
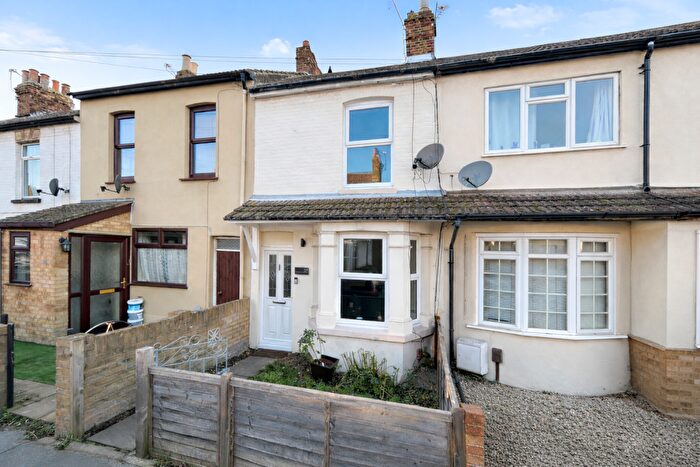
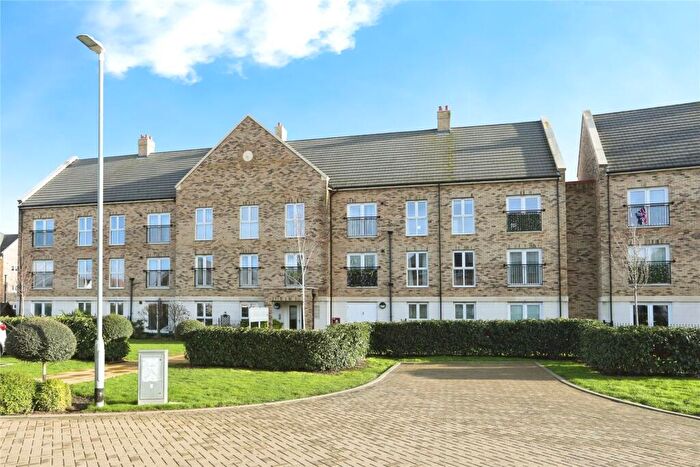
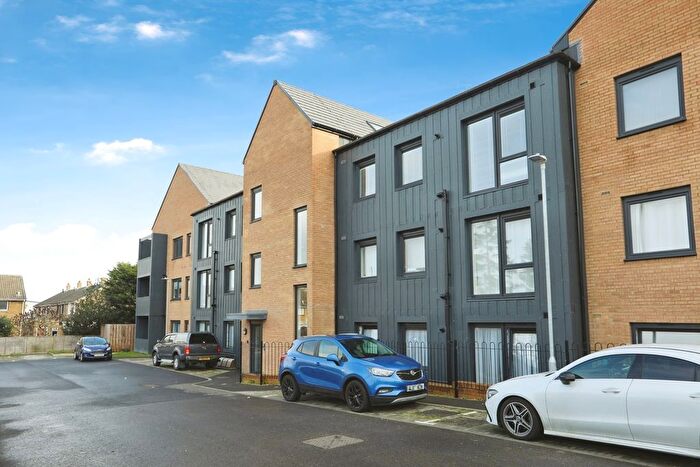
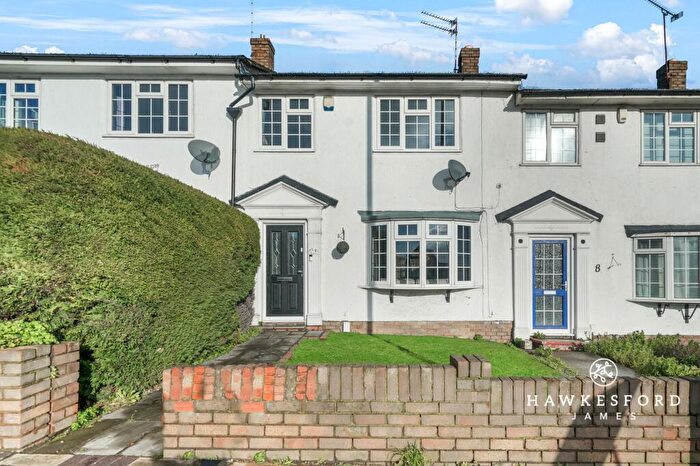
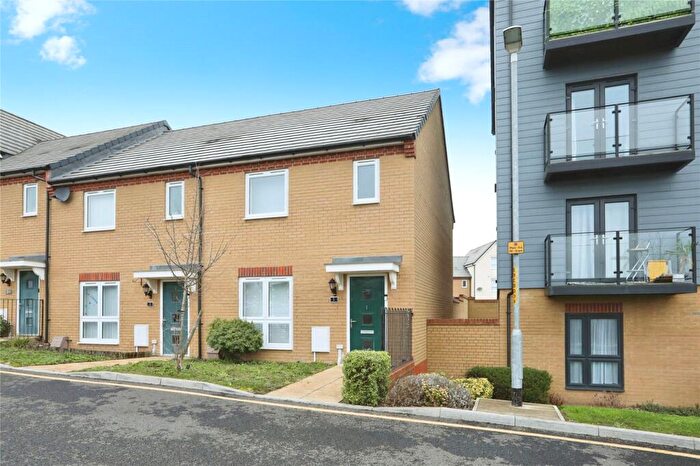
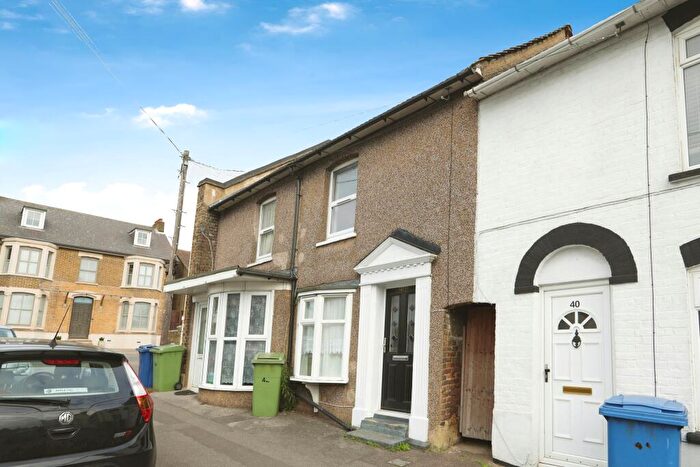
Houses for sale & to rent in Homewood, Sittingbourne
House Prices in Homewood
Properties in Homewood have an average house price of £180,800.00 and had 5 Property Transactions within the last 3 years¹.
Homewood is an area in Sittingbourne, Kent with 41 households², where the most expensive property was sold for £215,000.00.
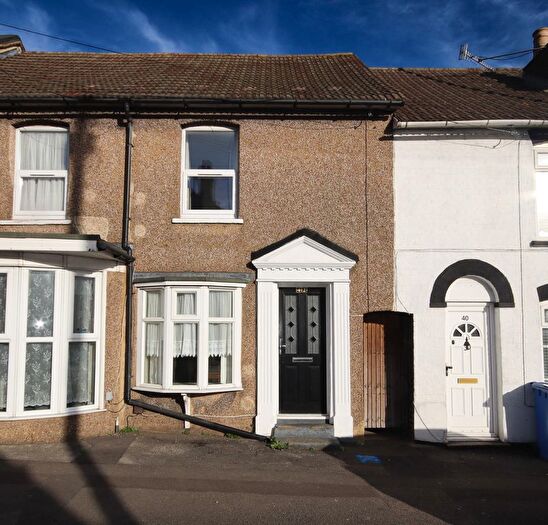
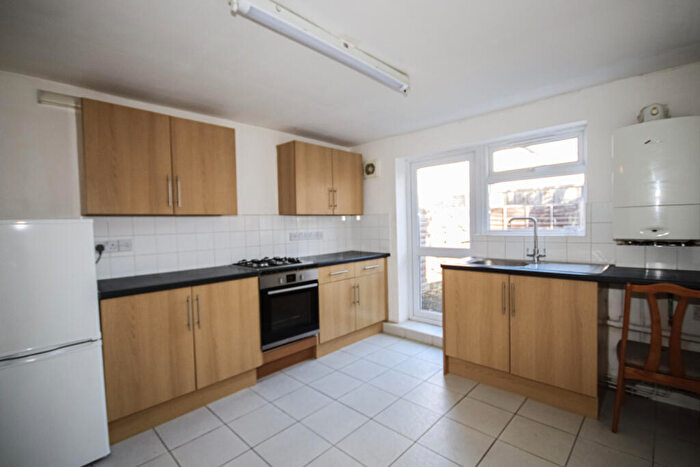
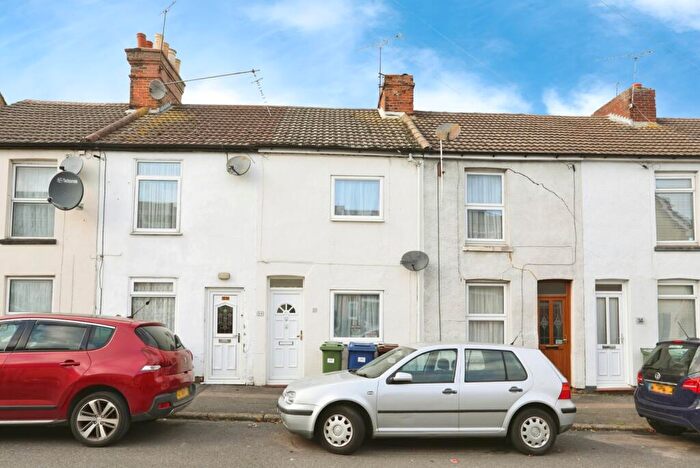
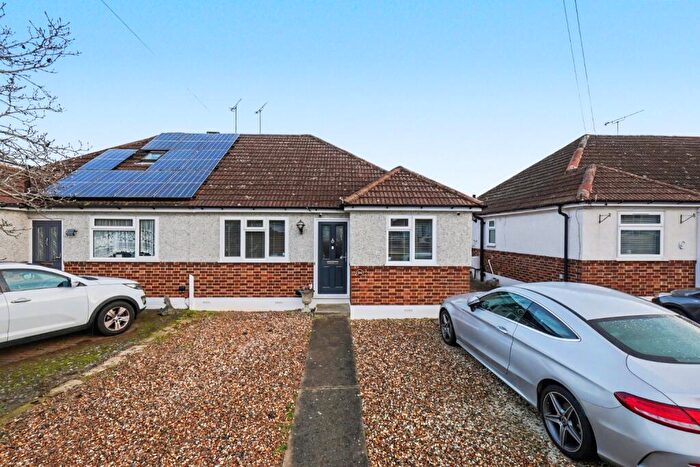
Properties for sale in Homewood
Roads and Postcodes in Homewood
Navigate through our locations to find the location of your next house in Homewood, Sittingbourne for sale or to rent.
| Streets | Postcodes |
|---|---|
| Albany Road | ME10 1FJ |
| Bell Road | ME10 4DH ME10 4RW |
| Borden Lane | ME9 8HP |
| Burley Road | ME10 1FD ME10 1JL ME10 1JX |
| Central Avenue | ME10 4AA ME10 4AE ME10 4AH ME10 4BX ME10 4NR ME10 4NU |
| East Street | ME10 9ZZ |
| Harmony Close | ME10 1QW |
| Homewood Avenue | ME10 1HQ |
| London Road | ME10 1FH |
| London Road Trading Estate | ME10 1SX |
| Roman Square | ME10 4BP |
| The Paddock | ME10 1UH |
| Ufton Lane | ME10 1AG |
| ME10 1AQ ME10 1WE ME10 1WF ME10 2DZ ME10 2WD ME10 2WQ ME10 3DG ME10 3HG ME10 3HW ME10 3JF ME10 3WX ME10 4DB ME10 4DD ME10 4DN ME10 4EQ ME10 4NN ME10 4XQ ME10 4YB ME10 9EB ME10 9EN ME10 9EP ME10 9ET ME10 9EW ME10 9FH ME10 9GJ ME10 9GQ ME10 9GS ME10 9GT ME10 9HE ME10 9HJ ME10 9HN ME10 9HU ME10 9JA ME10 9JD ME10 9JE ME10 9JG ME10 9JN ME10 9JQ ME10 9JS ME10 9JT ME10 9JU ME10 9JW ME10 9JX ME9 0WB ME9 7WA ME9 8GW ME9 9WX ME9 9YB ME10 9JZ ME10 9LB ME10 9LJ ME10 9LX ME10 9LY ME10 9LZ ME10 9NA ME10 9NG ME10 9NH ME10 9NJ ME10 9NL ME10 9NN |
Transport near Homewood
- FAQ
- Price Paid By Year
- Property Type Price
Frequently asked questions about Homewood
What is the average price for a property for sale in Homewood?
The average price for a property for sale in Homewood is £180,800. This amount is 43% lower than the average price in Sittingbourne. There are 2,059 property listings for sale in Homewood.
Which train stations are available in or near Homewood?
Some of the train stations available in or near Homewood are Sittingbourne, Kemsley and Newington.
Property Price Paid in Homewood by Year
The average sold property price by year was:
| Year | Average Sold Price | Price Change |
Sold Properties
|
|---|---|---|---|
| 2023 | £180,800 | 28% |
5 Properties |
| 2022 | £130,503 | -1271,6% |
1 Property |
| 2021 | £1,790,000 | 76% |
1 Property |
| 2020 | £435,000 | -15% |
1 Property |
| 2006 | £500,000 | - |
1 Property |
Property Price per Property Type in Homewood
Here you can find historic sold price data in order to help with your property search.
The average Property Paid Price for specific property types in the last three years are:
| Property Type | Average Sold Price | Sold Properties |
|---|---|---|
| Flat | £180,800.00 | 5 Flats |

