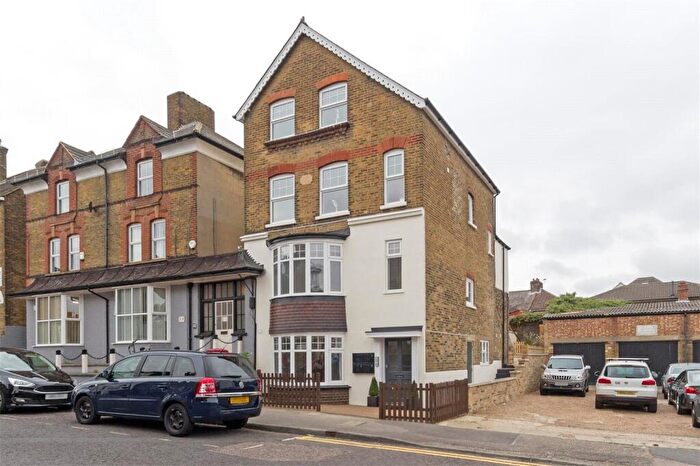
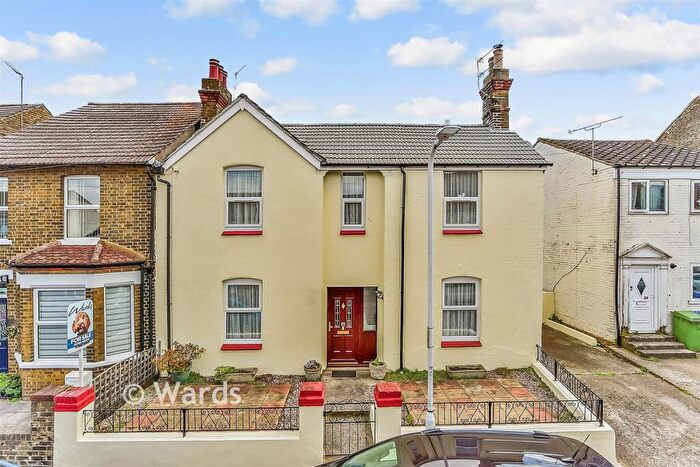
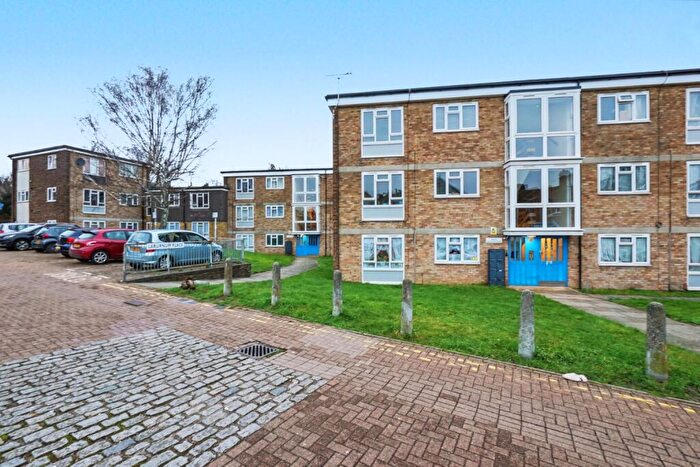
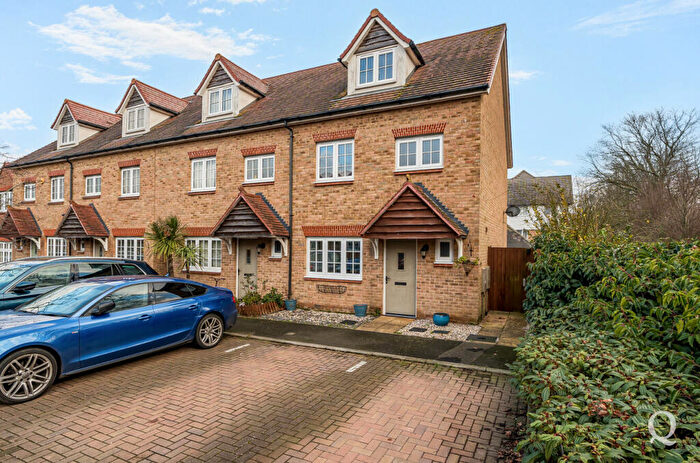
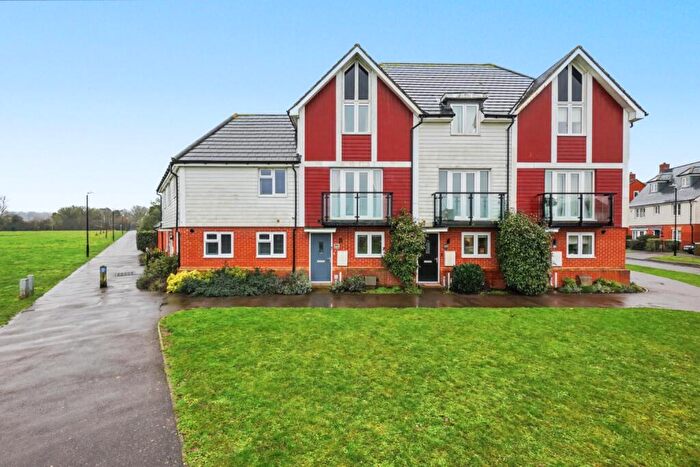
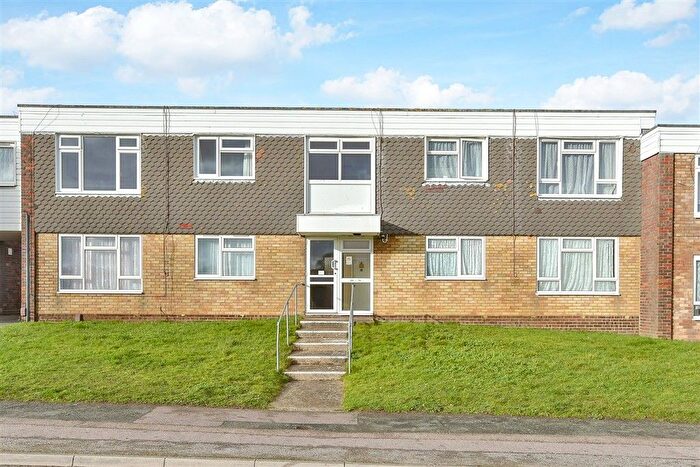
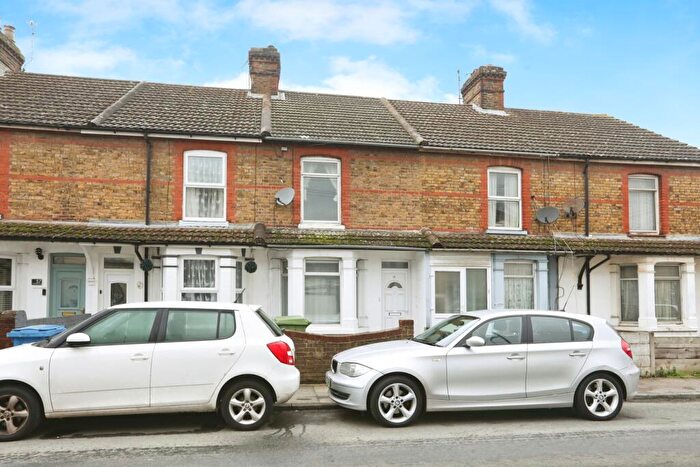
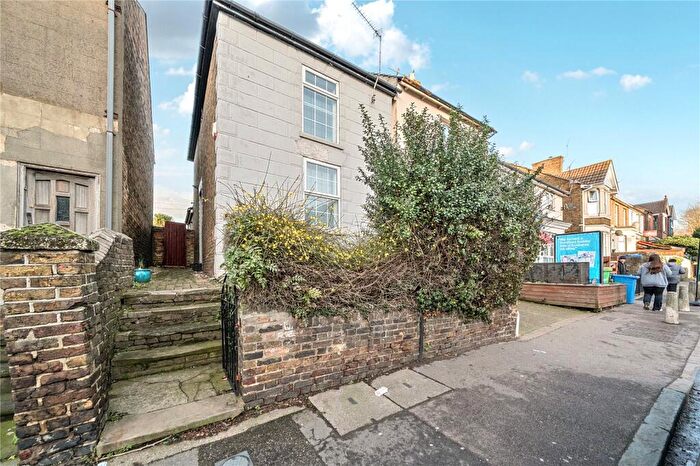
Houses for sale & to rent in Woodstock, Sittingbourne
House Prices in Woodstock
Properties in Woodstock have an average house price of £403,065.00 and had 201 Property Transactions within the last 3 years¹.
Woodstock is an area in Sittingbourne, Kent with 2,066 households², where the most expensive property was sold for £1,675,000.00.
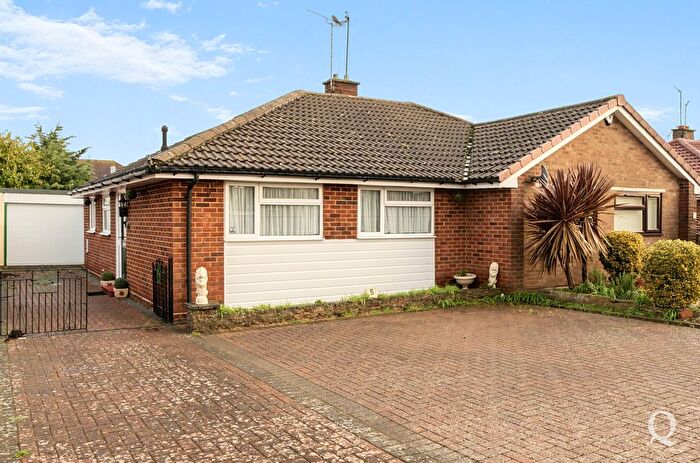
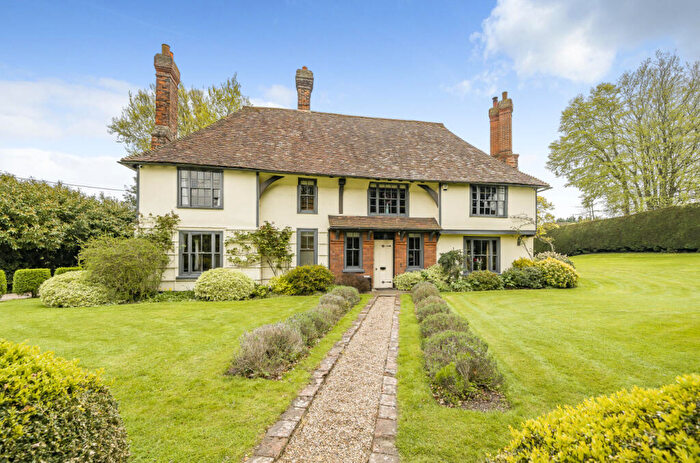
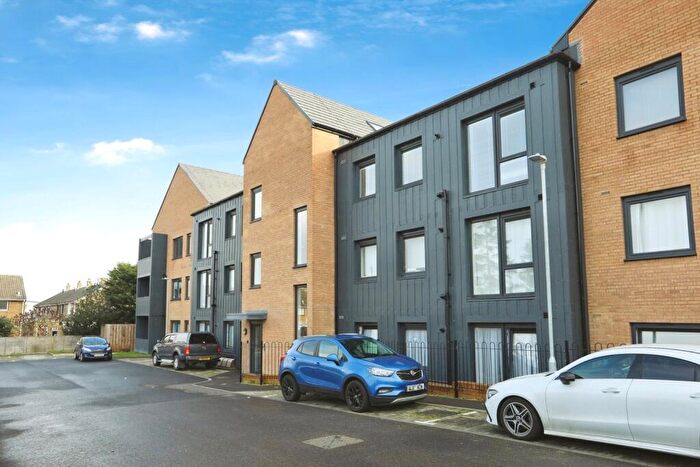
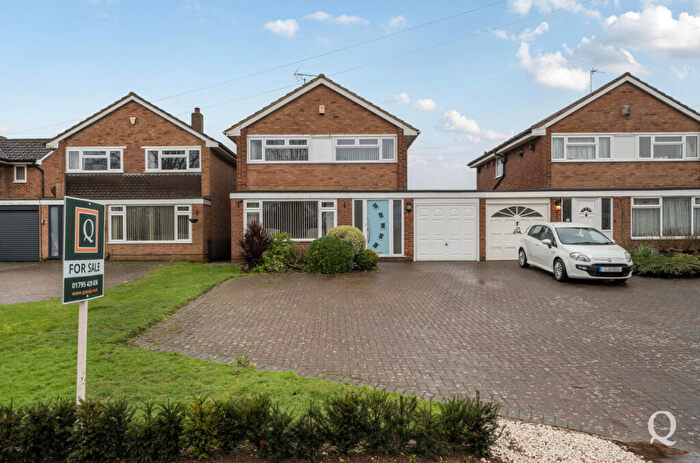
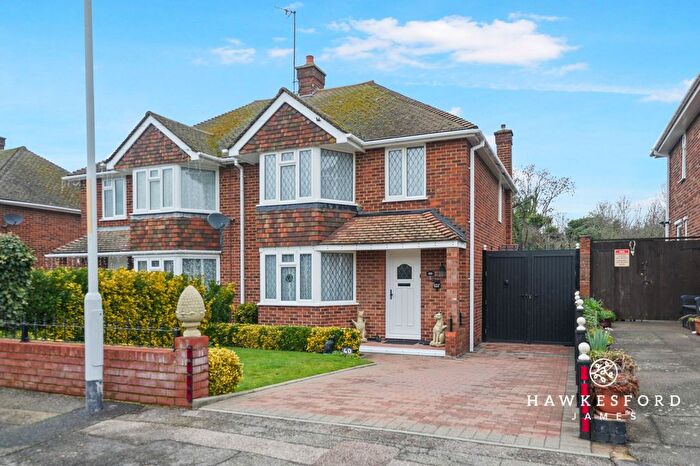
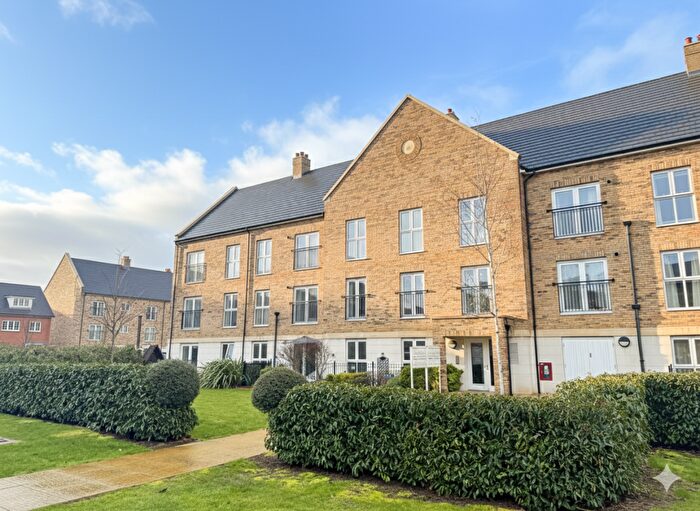
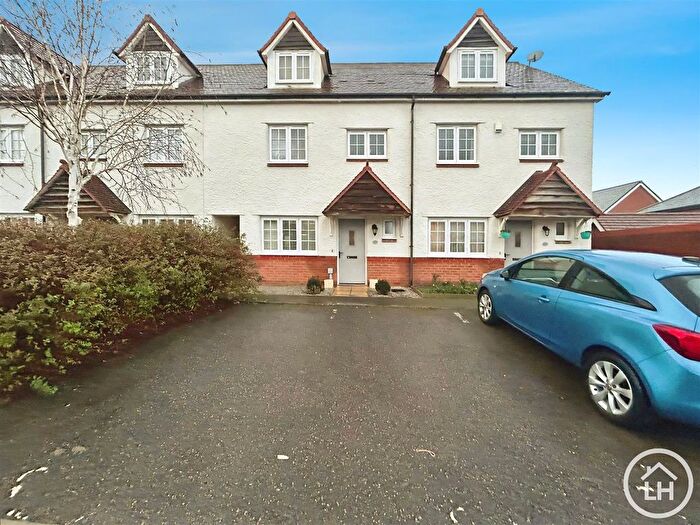
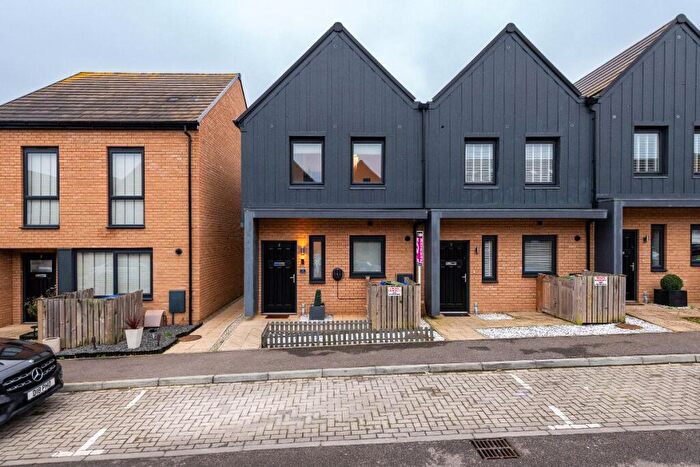
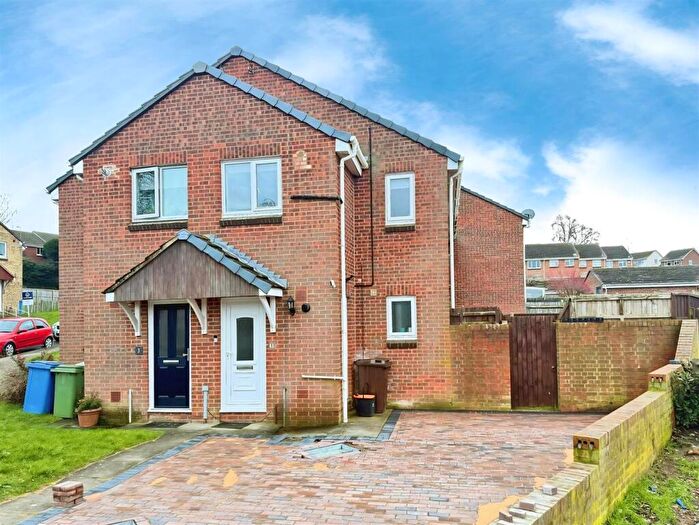
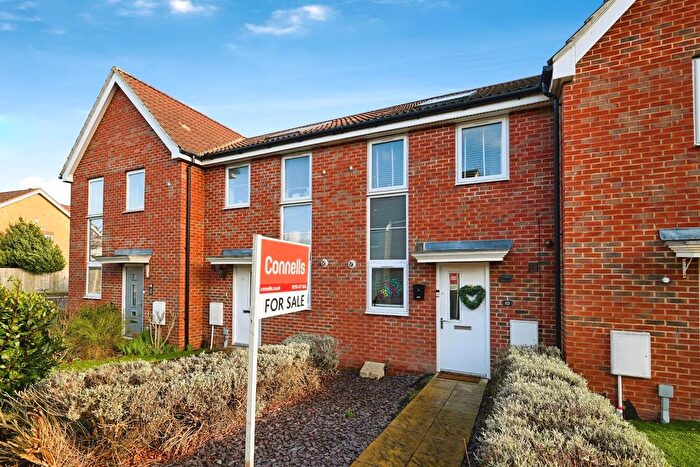
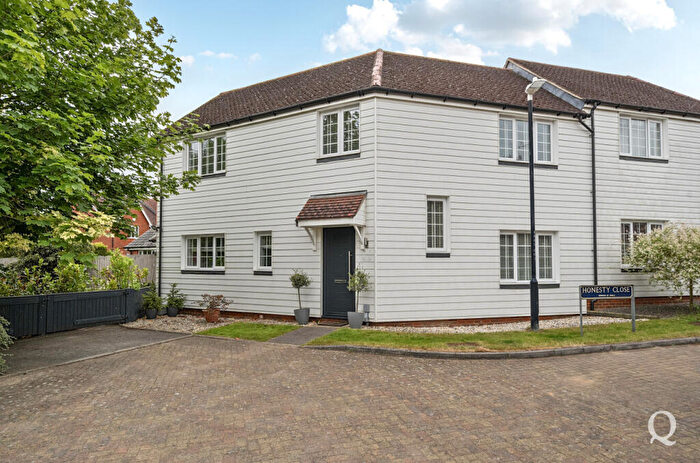
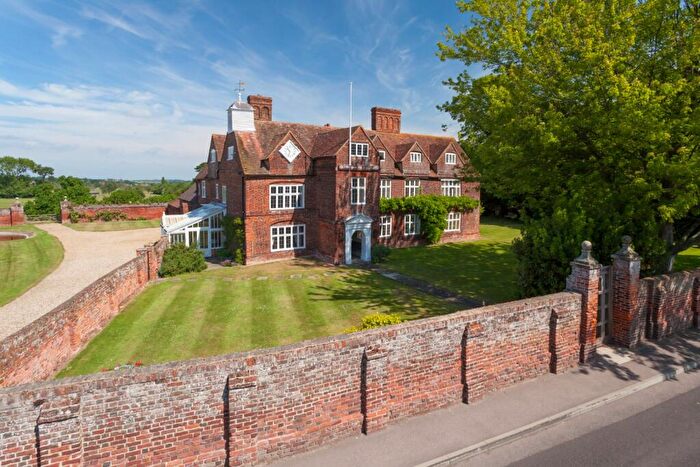
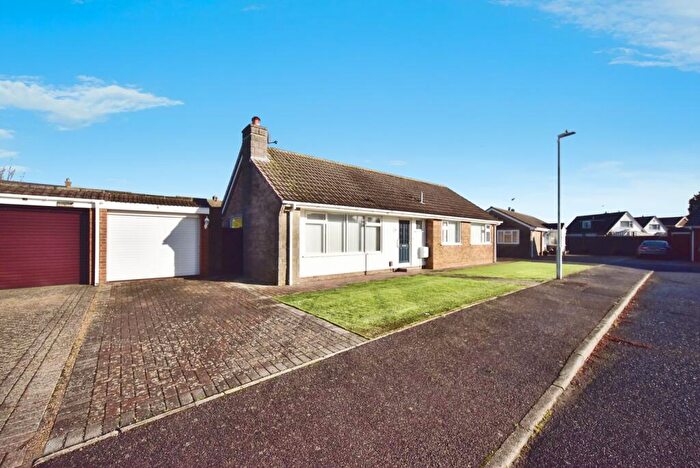
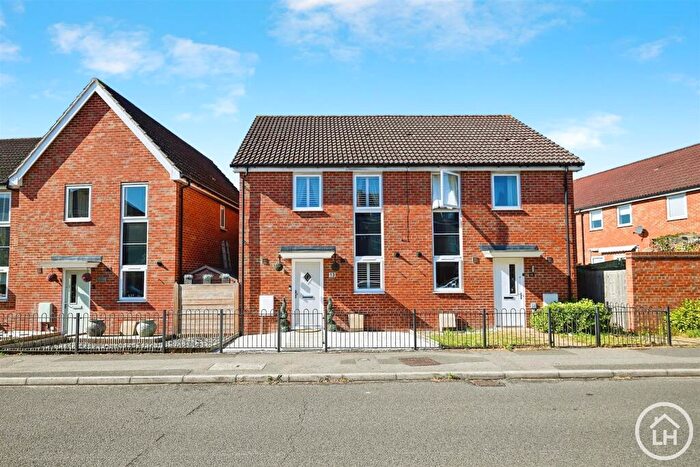
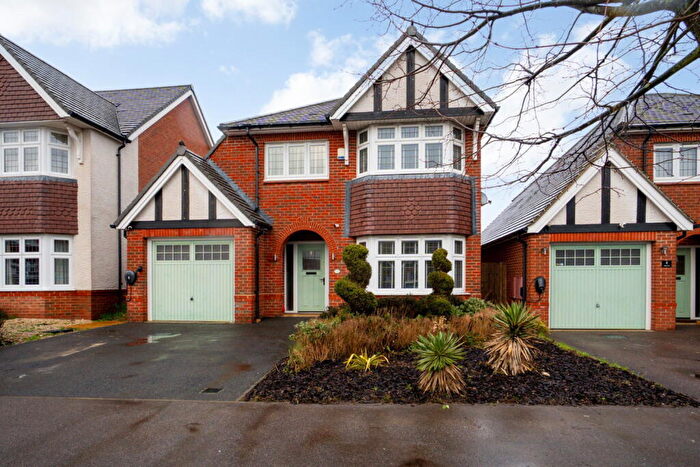
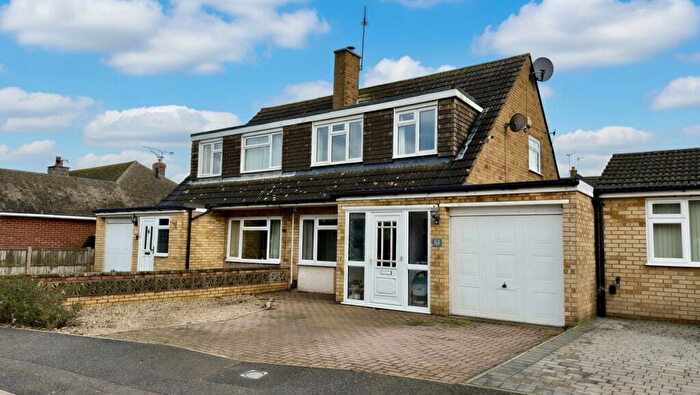
Properties for sale in Woodstock
Roads and Postcodes in Woodstock
Navigate through our locations to find the location of your next house in Woodstock, Sittingbourne for sale or to rent.
| Streets | Postcodes |
|---|---|
| Auckland Drive | ME10 1HL ME10 1HN |
| Bell Road | ME10 4DT ME10 4XX ME10 4EA |
| Berkeley Court | ME10 1UP ME10 1UR ME10 1UX |
| Blandford Gardens | ME10 4HW |
| Borden Lane | ME10 1BY ME10 1DA ME10 1DF ME10 1DG |
| Bradley Drive | ME10 1RB |
| Bramble Down Place | ME10 1FB |
| Bredgar Road | ME9 8EA |
| Chartwell Grove | ME10 1XD |
| Chaucer Road | ME10 1EZ |
| Chegworth Gardens | ME10 1RH ME10 1RJ |
| College Road | ME10 1LD ME10 1LH ME10 1LJ ME10 1LQ |
| Cranbrook Drive | ME10 1RE ME10 1RF |
| Cromers Road | ME10 4HP |
| Cryalls Lane | ME10 1YF |
| Doves Croft | ME9 8LQ |
| Downs Close | ME10 1SP |
| Dunedin Close | ME10 1RX |
| Fernleigh Terrace | ME10 1SQ |
| Flint Cottages | ME9 8DU |
| Gore Court Road | ME10 1QL ME10 1QN ME10 1QP ME10 1GL ME10 1QJ |
| Grayling Court | ME10 1LE |
| Hales Road | ME10 1SR |
| Hamilton Crescent | ME10 1HW ME10 1HZ |
| Hearts Delight Road | ME9 8JA ME9 8JB |
| Hever Place | ME10 1HE |
| Highsted Road | ME10 4PT ME9 0AA |
| Hill Brow | ME10 1UW |
| Homewood Avenue | ME10 1HH ME10 1XJ ME10 1XN |
| Kent Avenue | ME10 1HA ME10 1HB ME10 1HD |
| Linden Close | ME10 1HF |
| Lyndhurst Grove | ME10 1QH |
| Minterne Avenue | ME10 1SA ME10 1SB ME10 1SD ME10 1SE |
| Napier Close | ME10 1RU |
| Oast Court | ME10 4DY |
| Park Avenue | ME10 1QX ME10 1QY |
| Park Drive | ME10 1RD ME10 1RL ME10 1RN ME10 1RW |
| Park Road | ME10 1EP ME10 1ER ME10 1ES |
| Riverhead Close | ME10 1UZ |
| Roseleigh Road | ME10 1RP ME10 1RR ME10 1RS |
| Ruins Barn Road | ME10 4HS ME9 8AA |
| Russell Close | ME10 1RT |
| Silverdale Grove | ME10 1UY |
| Sterling Road | ME10 1SH ME10 1SJ ME10 1SL ME10 1SN ME10 1SS ME10 1ST ME10 1SW |
| Tunstall Road | ME10 1YG ME10 1YQ |
| Ufton Lane | ME10 1EU ME10 1EX |
| Weald Court | ME10 1RY |
| West Ridge | ME10 1UJ ME10 1UQ |
| Westerham Road | ME10 1XA ME10 1XB ME10 1XF ME10 1XG ME10 1XH |
| Windermere Grove | ME10 1UU |
| Windsor Drive | ME10 1UL ME10 1UN |
| Woodcourt Close | ME10 1QT |
| Woodside Gardens | ME10 1SF ME10 1SG |
| Woodstock Road | ME10 4HH ME10 4HJ ME10 4HL ME10 4HN |
| ME9 8DX |
Transport near Woodstock
- FAQ
- Price Paid By Year
- Property Type Price
Frequently asked questions about Woodstock
What is the average price for a property for sale in Woodstock?
The average price for a property for sale in Woodstock is £403,065. This amount is 28% higher than the average price in Sittingbourne. There are 3,908 property listings for sale in Woodstock.
What streets have the most expensive properties for sale in Woodstock?
The streets with the most expensive properties for sale in Woodstock are Gore Court Road at an average of £825,000, Hearts Delight Road at an average of £805,400 and Doves Croft at an average of £803,750.
What streets have the most affordable properties for sale in Woodstock?
The streets with the most affordable properties for sale in Woodstock are Chaucer Road at an average of £200,054, Riverhead Close at an average of £271,000 and Homewood Avenue at an average of £282,500.
Which train stations are available in or near Woodstock?
Some of the train stations available in or near Woodstock are Sittingbourne, Kemsley and Newington.
Property Price Paid in Woodstock by Year
The average sold property price by year was:
| Year | Average Sold Price | Price Change |
Sold Properties
|
|---|---|---|---|
| 2025 | £430,061 | 13% |
65 Properties |
| 2024 | £372,318 | -10% |
73 Properties |
| 2023 | £410,840 | -3% |
63 Properties |
| 2022 | £424,355 | 11% |
71 Properties |
| 2021 | £379,621 | 5% |
81 Properties |
| 2020 | £359,433 | -0,2% |
78 Properties |
| 2019 | £360,081 | -1% |
63 Properties |
| 2018 | £363,019 | -3% |
78 Properties |
| 2017 | £375,549 | 11% |
52 Properties |
| 2016 | £335,227 | 14% |
77 Properties |
| 2015 | £287,907 | 16% |
97 Properties |
| 2014 | £242,572 | 3% |
83 Properties |
| 2013 | £234,885 | -1% |
66 Properties |
| 2012 | £237,213 | -3% |
60 Properties |
| 2011 | £244,075 | 1% |
72 Properties |
| 2010 | £241,813 | 5% |
61 Properties |
| 2009 | £230,745 | 3% |
63 Properties |
| 2008 | £224,846 | -8% |
33 Properties |
| 2007 | £243,830 | 5% |
85 Properties |
| 2006 | £232,498 | 3% |
82 Properties |
| 2005 | £225,777 | 6% |
55 Properties |
| 2004 | £212,422 | 14% |
84 Properties |
| 2003 | £182,067 | 12% |
74 Properties |
| 2002 | £160,208 | 5% |
99 Properties |
| 2001 | £152,285 | 9% |
80 Properties |
| 2000 | £138,518 | 13% |
91 Properties |
| 1999 | £120,407 | 13% |
109 Properties |
| 1998 | £105,082 | 17% |
86 Properties |
| 1997 | £87,645 | 12% |
94 Properties |
| 1996 | £77,210 | 0,4% |
91 Properties |
| 1995 | £76,933 | - |
87 Properties |
Property Price per Property Type in Woodstock
Here you can find historic sold price data in order to help with your property search.
The average Property Paid Price for specific property types in the last three years are:
| Property Type | Average Sold Price | Sold Properties |
|---|---|---|
| Semi Detached House | £366,483.00 | 128 Semi Detached Houses |
| Detached House | £557,871.00 | 49 Detached Houses |
| Terraced House | £295,347.00 | 20 Terraced Houses |
| Flat | £215,932.00 | 4 Flats |

