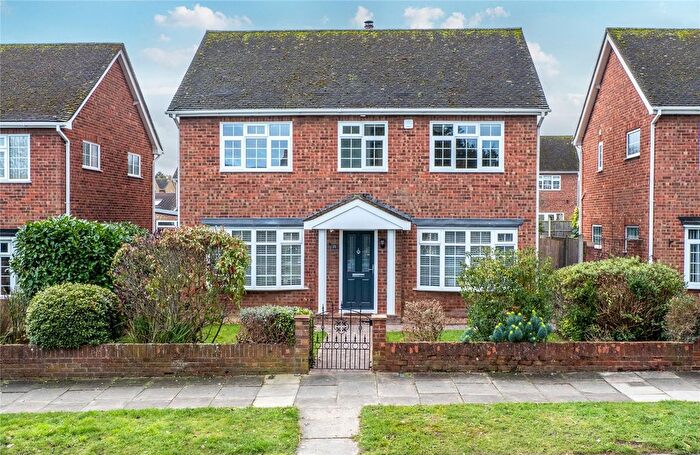
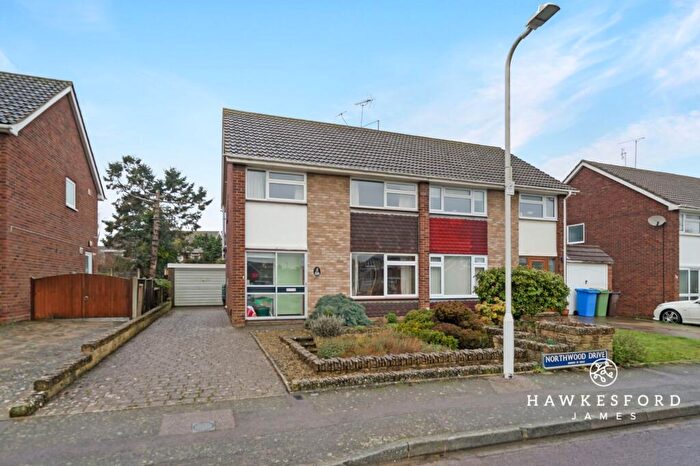
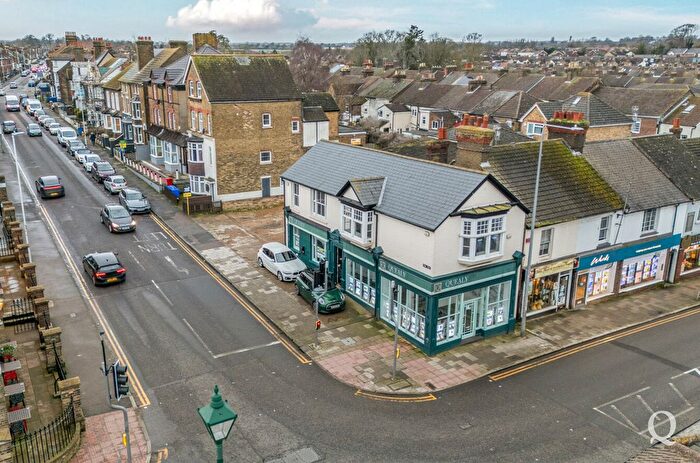
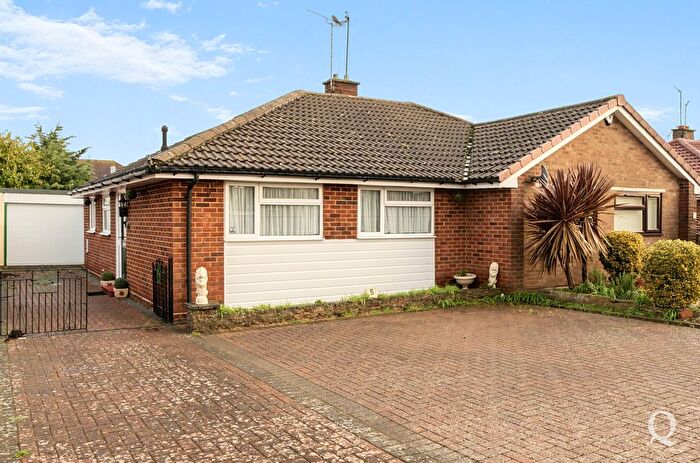
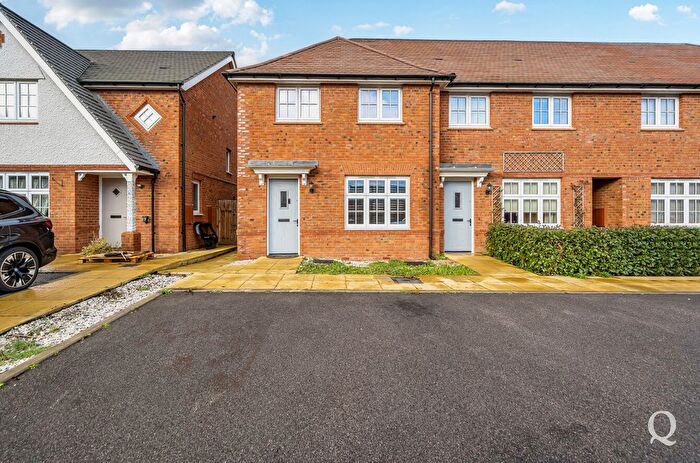
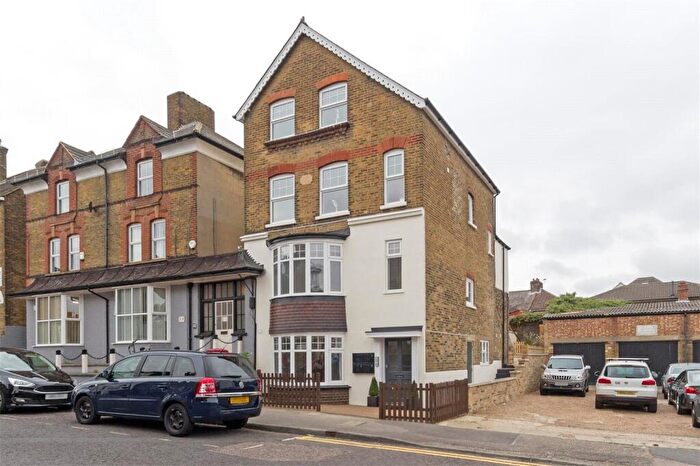
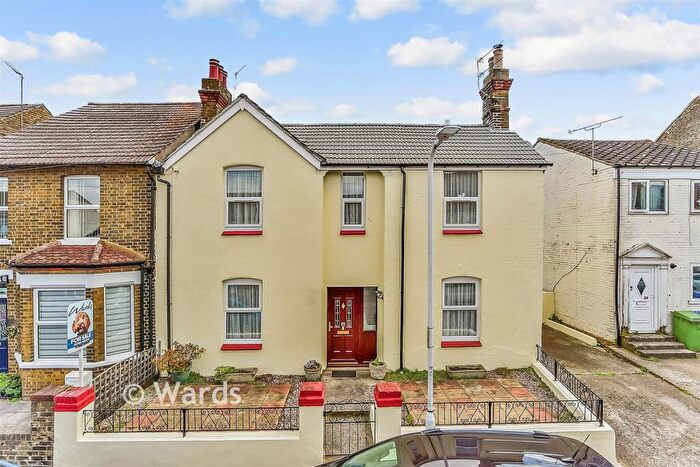
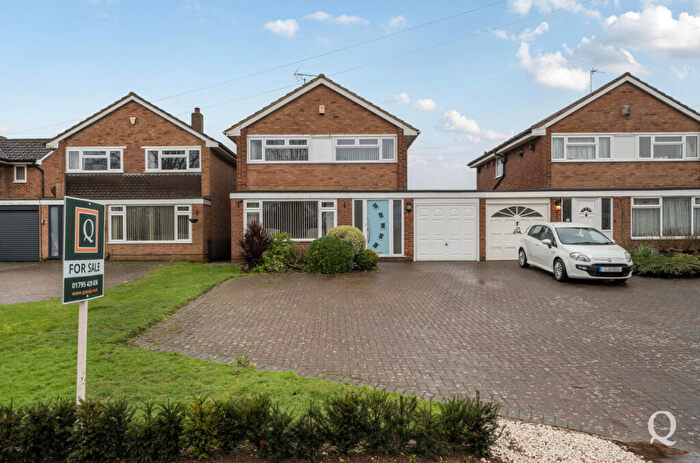
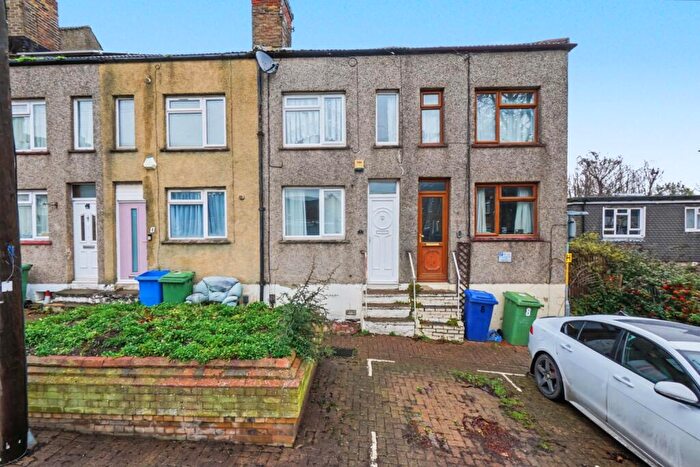
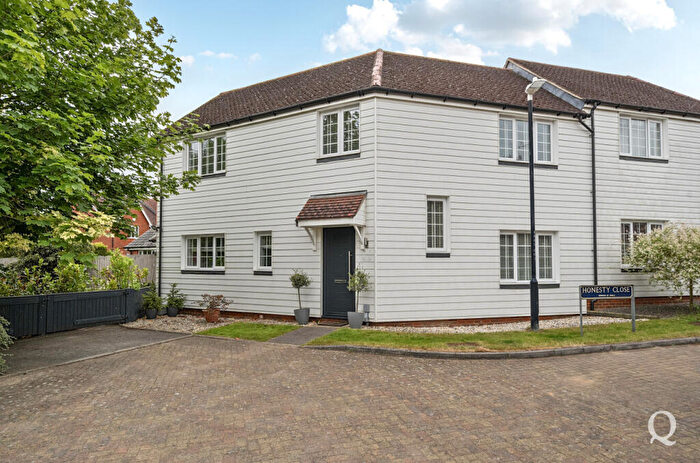
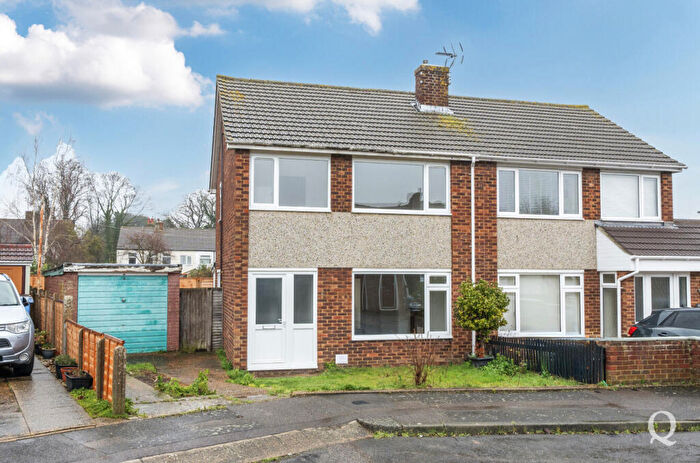
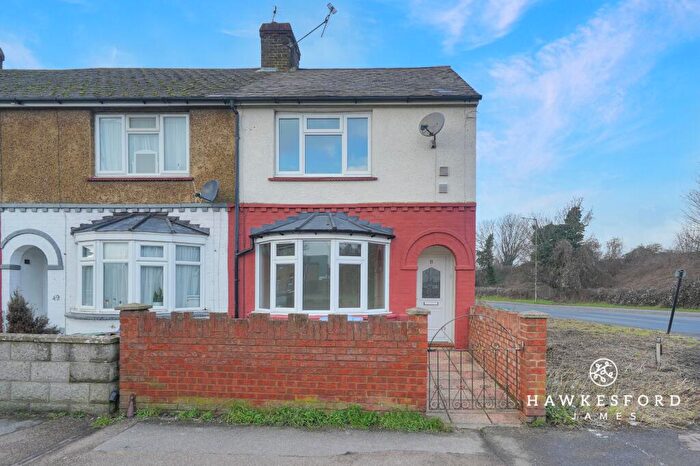
Houses for sale & to rent in St Michaels, Sittingbourne
House Prices in St Michaels
Properties in St Michaels have an average house price of £313,611.00 and had 244 Property Transactions within the last 3 years¹.
St Michaels is an area in Sittingbourne, Kent with 2,421 households², where the most expensive property was sold for £740,000.00.
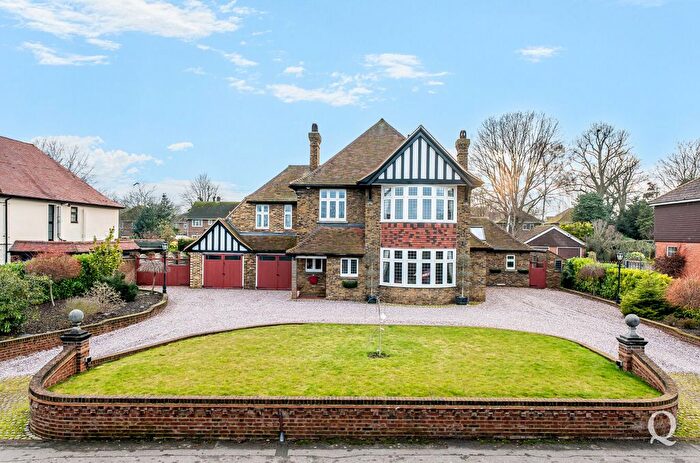
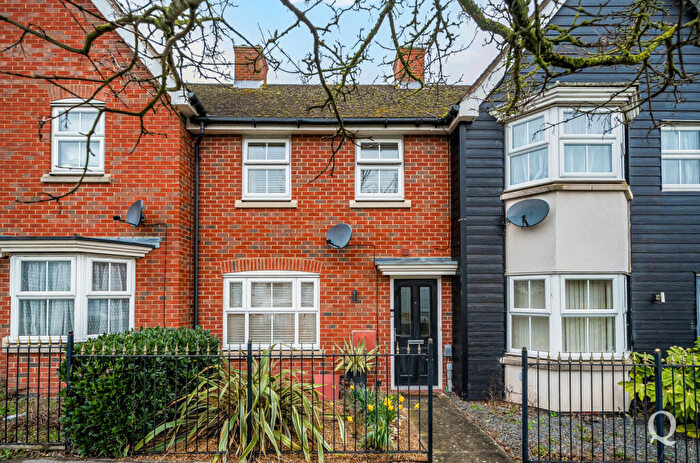
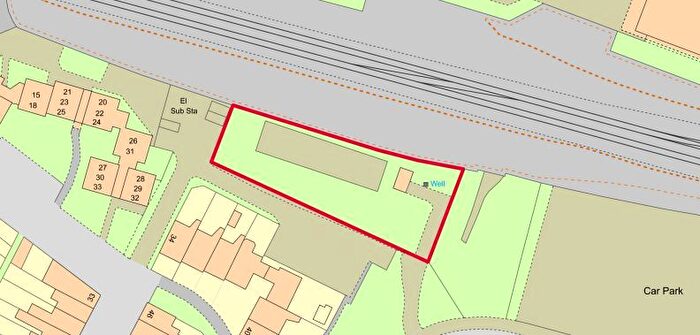
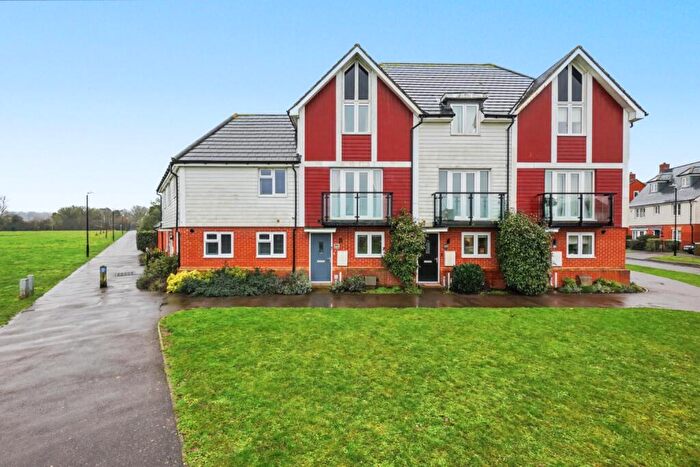
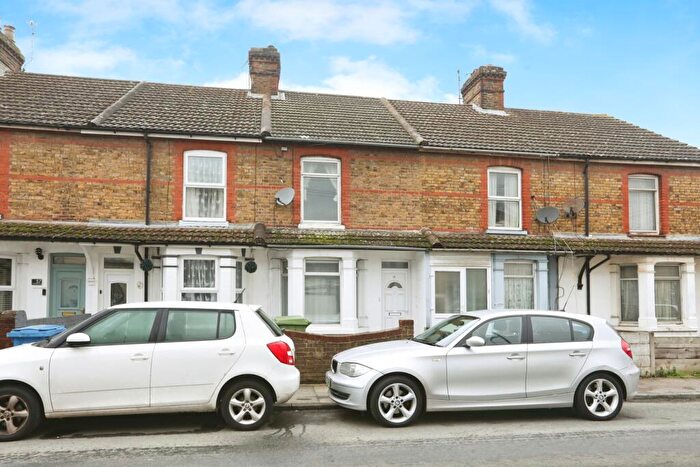
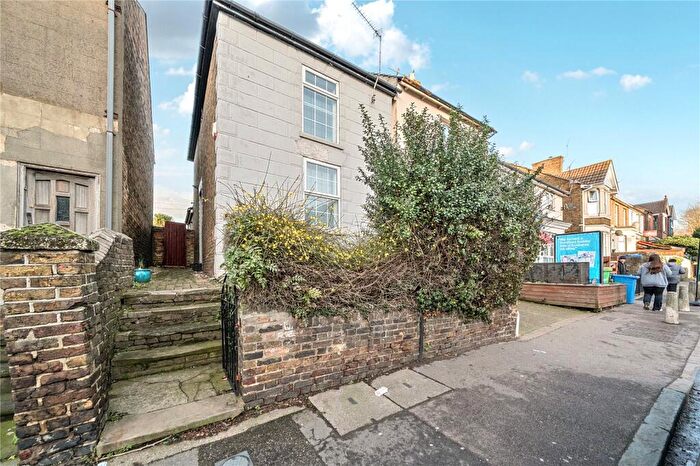
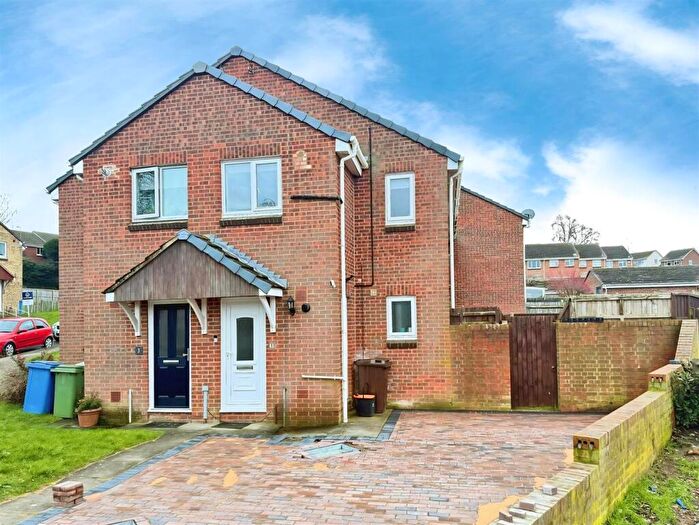
Properties for sale in St Michaels
Roads and Postcodes in St Michaels
Navigate through our locations to find the location of your next house in St Michaels, Sittingbourne for sale or to rent.
| Streets | Postcodes |
|---|---|
| Addington Road | ME10 1EA ME10 1HU |
| Albany Road | ME10 1EB ME10 1EL |
| Arundel Avenue | ME10 4RG |
| Aubretia Walk | ME10 4TL |
| Avenue Of Remembrance | ME10 4DE |
| Bell Road | ME10 4DL ME10 4DP ME10 4DS ME10 4EB ME10 4EE ME10 4HE ME10 4HG |
| Belmont Road | ME10 1EF |
| Bergamot Close | ME10 4EX ME10 4EY |
| Bluebell Drive | ME10 4EL ME10 4EN |
| Brenchley Road | ME10 4EG |
| Capel Road | ME10 4EP |
| Carnation Crescent | ME10 4RY |
| Chilton Avenue | ME10 4TB ME10 4TD ME10 4TE |
| Clarendon Close | ME10 4RL |
| Cobham Avenue | ME10 4RD |
| Connaught Road | ME10 1EH |
| Crocus Drive | ME10 4ES |
| Crossways | ME10 4BY ME10 4RH ME10 4RJ ME10 4RN |
| Daisy Walk | ME10 4EJ |
| East Street | ME10 4BL ME10 4BQ ME10 4RT |
| Fairview Road | ME10 4TH ME10 4TN |
| Farm Crescent | ME10 4QD |
| Gerrards Drive | ME10 4QU |
| Glovers Crescent | ME10 4DU |
| Grayshott Close | ME10 4PU |
| Hanover Close | ME10 4ET |
| Haysel | ME10 4QE |
| Heather Close | ME10 4TJ |
| High Street | ME10 4AJ ME10 4AW ME10 4PB ME10 4PD ME10 4PL |
| Highsted Road | ME10 4PS ME10 4QH |
| Honesty Close | ME10 4AG |
| Iris Drive | ME10 4RR |
| Kestrel Close | ME10 4PX |
| Kiln Close | ME10 4TS |
| Lavender Court | ME10 4TA |
| Lily Walk | ME10 4BF |
| Lime Grove | ME10 3JR |
| Little Glovers | ME10 4DX |
| Manwood Close | ME10 4QL |
| Marigold Drive | ME10 4BZ |
| Marjoram Drive | ME10 4EH |
| Meadowsweet Walk | ME10 4EU |
| Millfield | ME10 4TP ME10 4TR |
| Northwood Drive | ME10 4QN ME10 4QR ME10 4QS |
| Oast Court | ME10 4DZ |
| Park Road | ME10 1DR ME10 1DY ME10 1DZ ME10 1EQ ME10 1EW |
| Pembury Street | ME10 3EE |
| Peony Crescent | ME10 4RB |
| Pond Drive | ME10 4QF |
| Primrose Avenue | ME10 4FE |
| Roman Square | ME10 4BJ |
| Ronalds Court | ME10 4SW |
| Roonagh Court | ME10 1QS |
| Rose Walk | ME10 4EW |
| Shurland Avenue | ME10 4QT |
| Snowdrop Walk | ME10 4EZ |
| St Michaels Close | ME10 3DH |
| St Michaels Road | ME10 3DN |
| Stanhope Avenue | ME10 4TT ME10 4TU ME10 4TX |
| Station Street | ME10 3DU |
| The Fairway | ME10 4QX ME10 4RA ME10 4RE |
| The Fieldings | ME10 4HA |
| The Finches | ME10 4PY |
| The Meadows | ME10 4QW |
| The Mews | ME10 4EF |
| The Parade | ME10 4QJ |
| The Roundel | ME10 4QP |
| Trotts Hall Gardens | ME10 4DG |
| Tulip Walk | ME10 4BE |
| Unity Street | ME10 1EG |
| Valenciennes Road | ME10 1EN |
| Victoria Mews | ME10 4BW |
| Viners Close | ME10 4QZ |
| Violet Court | ME10 4ER |
| West Lane | ME10 3AA ME10 3TU |
| West Street | ME10 1AB ME10 1AP ME10 1AW |
| Whitehall Court | ME10 4ED |
| Whitehall Road | ME10 4HB |
Transport near St Michaels
- FAQ
- Price Paid By Year
- Property Type Price
Frequently asked questions about St Michaels
What is the average price for a property for sale in St Michaels?
The average price for a property for sale in St Michaels is £313,611. This amount is 0.7% lower than the average price in Sittingbourne. There are 1,777 property listings for sale in St Michaels.
What streets have the most expensive properties for sale in St Michaels?
The streets with the most expensive properties for sale in St Michaels are Whitehall Road at an average of £665,000, Snowdrop Walk at an average of £550,000 and Highsted Road at an average of £544,714.
What streets have the most affordable properties for sale in St Michaels?
The streets with the most affordable properties for sale in St Michaels are Oast Court at an average of £128,500, Victoria Mews at an average of £140,000 and East Street at an average of £142,800.
Which train stations are available in or near St Michaels?
Some of the train stations available in or near St Michaels are Sittingbourne, Kemsley and Teynham.
Property Price Paid in St Michaels by Year
The average sold property price by year was:
| Year | Average Sold Price | Price Change |
Sold Properties
|
|---|---|---|---|
| 2025 | £334,984 | 9% |
65 Properties |
| 2024 | £306,291 | 0,3% |
103 Properties |
| 2023 | £305,251 | -5% |
76 Properties |
| 2022 | £321,160 | 18% |
101 Properties |
| 2021 | £262,269 | -2% |
118 Properties |
| 2020 | £268,535 | -4% |
99 Properties |
| 2019 | £278,475 | 4% |
80 Properties |
| 2018 | £268,455 | -3% |
98 Properties |
| 2017 | £276,431 | 9% |
130 Properties |
| 2016 | £250,537 | 10% |
122 Properties |
| 2015 | £225,505 | 14% |
89 Properties |
| 2014 | £194,114 | 3% |
115 Properties |
| 2013 | £189,183 | 5% |
88 Properties |
| 2012 | £179,572 | -2% |
79 Properties |
| 2011 | £182,883 | -2% |
99 Properties |
| 2010 | £187,429 | 3% |
117 Properties |
| 2009 | £182,287 | -13% |
98 Properties |
| 2008 | £205,416 | -3% |
112 Properties |
| 2007 | £211,572 | 0,2% |
186 Properties |
| 2006 | £211,192 | 13% |
194 Properties |
| 2005 | £184,562 | 10% |
113 Properties |
| 2004 | £166,232 | 12% |
131 Properties |
| 2003 | £146,901 | 15% |
101 Properties |
| 2002 | £125,185 | 22% |
97 Properties |
| 2001 | £98,136 | -6% |
77 Properties |
| 2000 | £104,192 | 22% |
82 Properties |
| 1999 | £81,174 | 15% |
103 Properties |
| 1998 | £69,329 | 1% |
84 Properties |
| 1997 | £68,797 | 5% |
68 Properties |
| 1996 | £65,526 | 7% |
81 Properties |
| 1995 | £60,928 | - |
78 Properties |
Property Price per Property Type in St Michaels
Here you can find historic sold price data in order to help with your property search.
The average Property Paid Price for specific property types in the last three years are:
| Property Type | Average Sold Price | Sold Properties |
|---|---|---|
| Semi Detached House | £358,732.00 | 91 Semi Detached Houses |
| Detached House | £446,894.00 | 38 Detached Houses |
| Terraced House | £289,429.00 | 72 Terraced Houses |
| Flat | £140,825.00 | 43 Flats |

