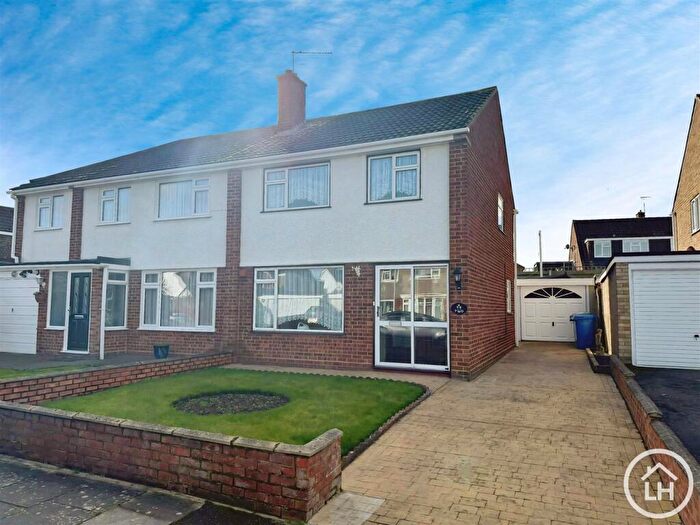
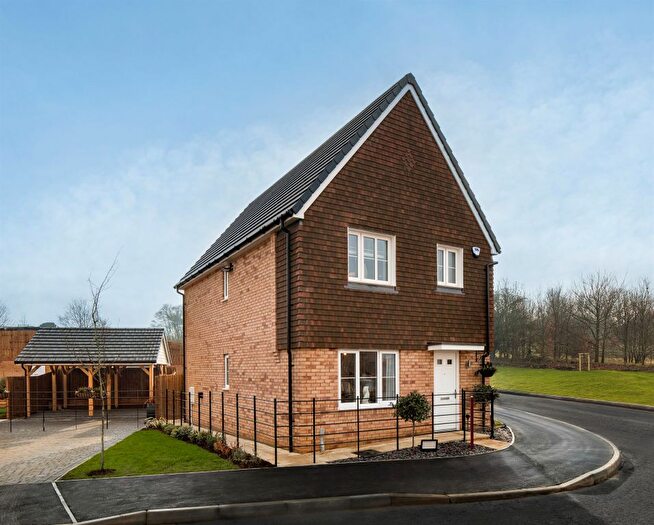
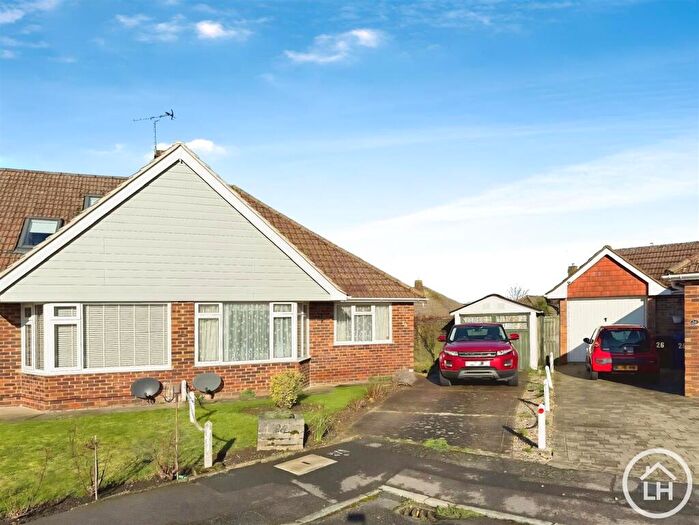
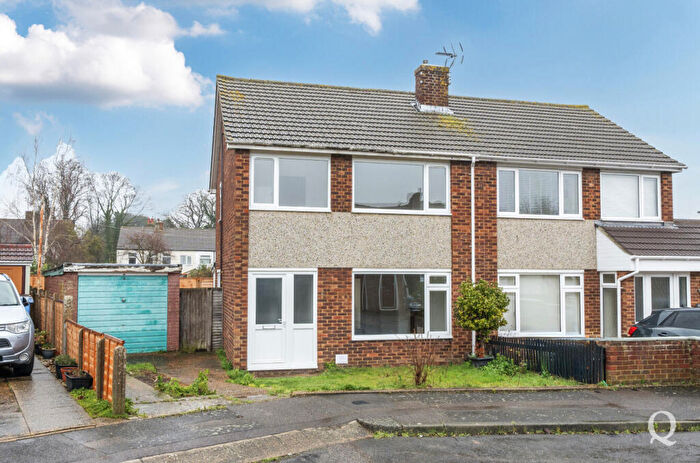
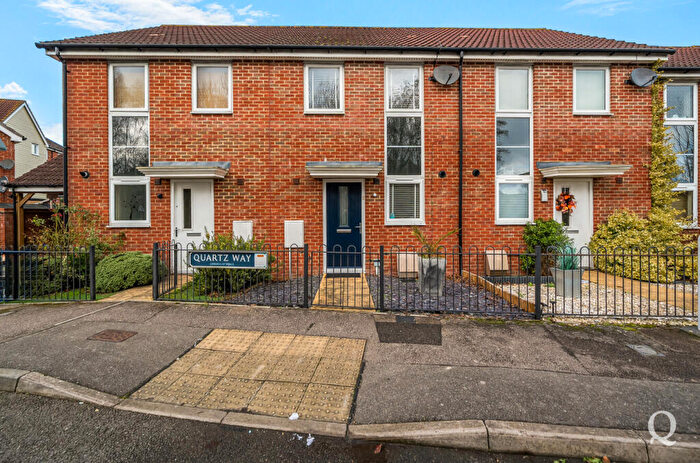
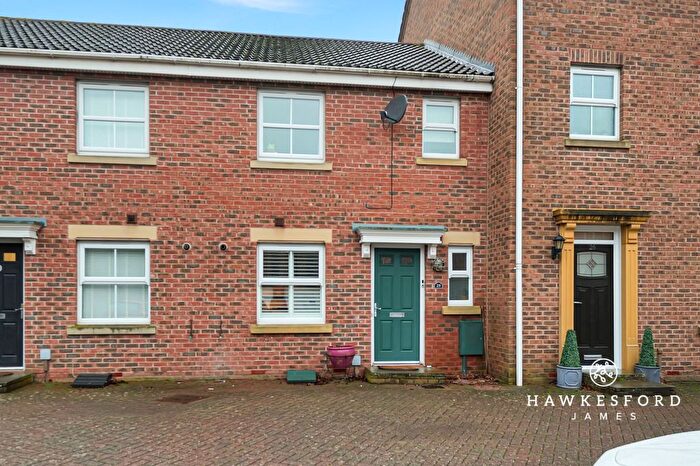
Houses for sale & to rent in Borden, Sittingbourne
House Prices in Borden
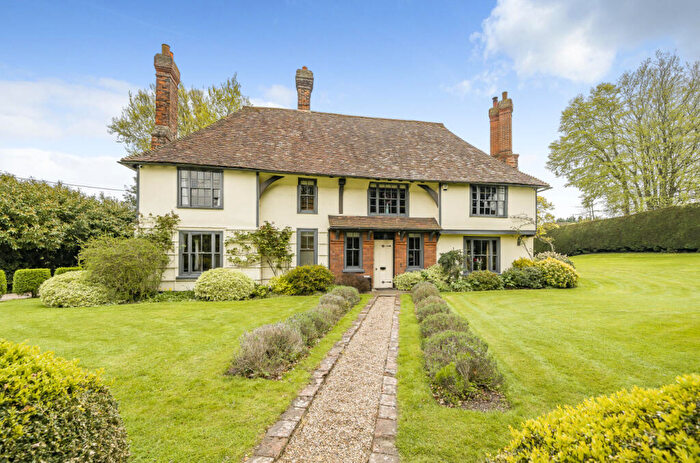
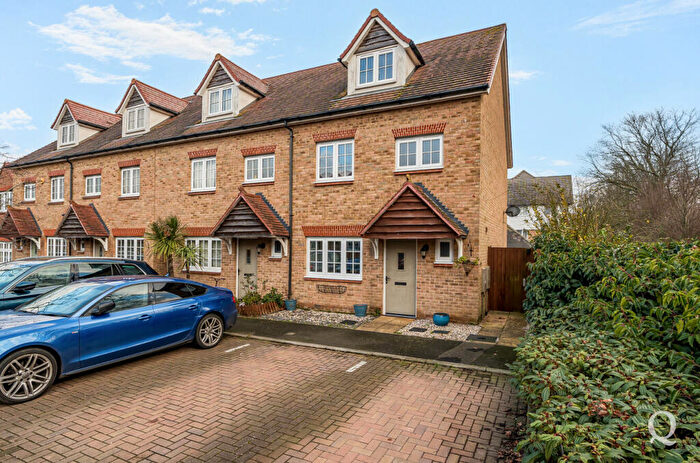
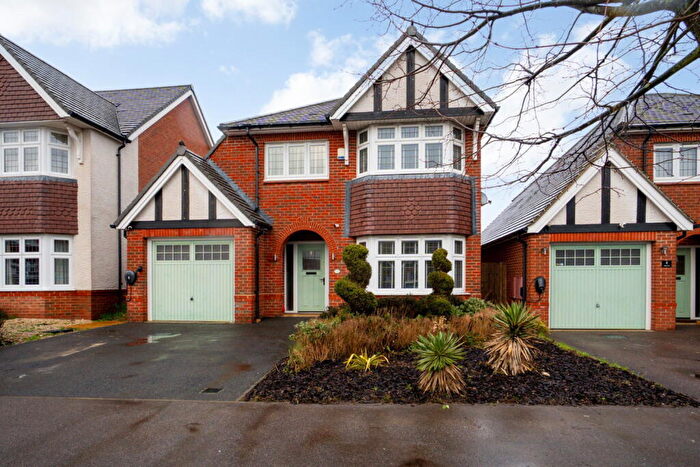
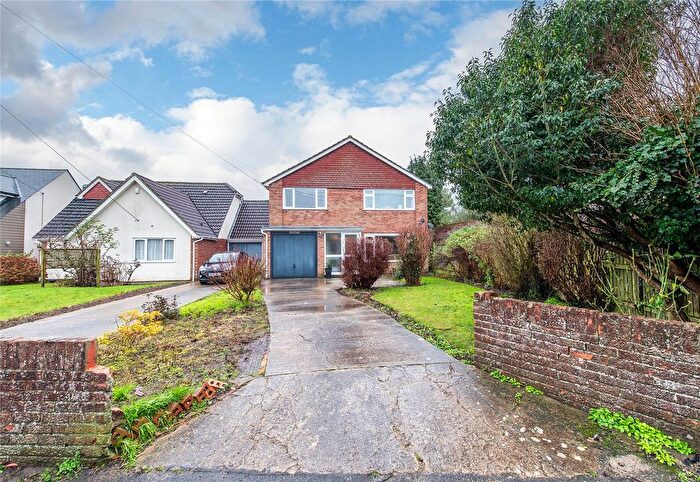
Properties in Borden have an average house price of £454,987.00 and had 75 Property Transactions within the last 3 years¹.
Borden is an area in Sittingbourne, Kent with 990 households², where the most expensive property was sold for £930,000.00.
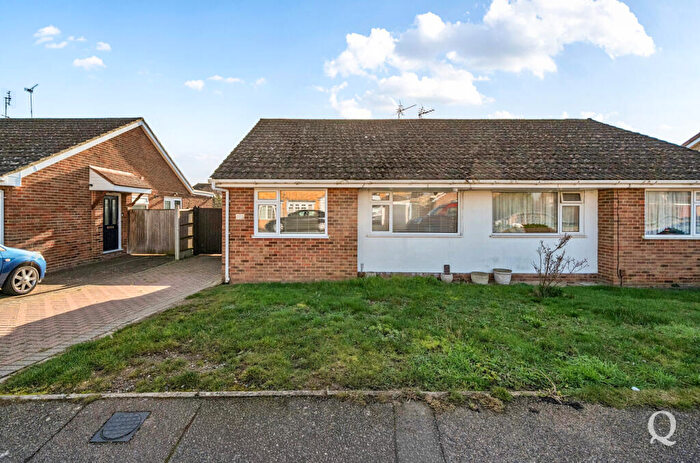
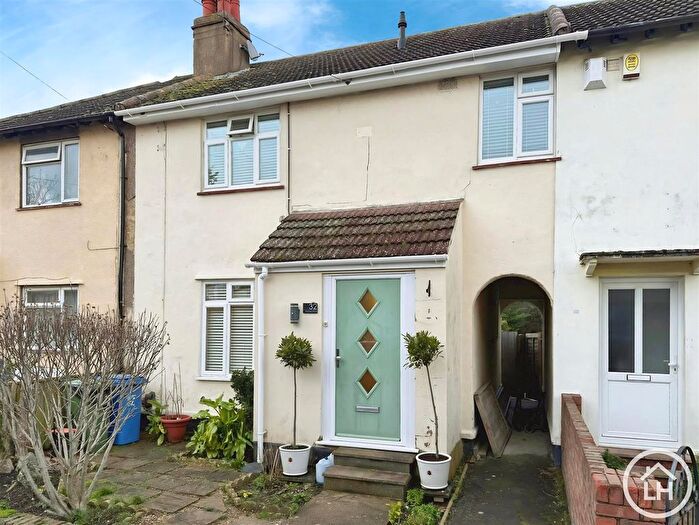
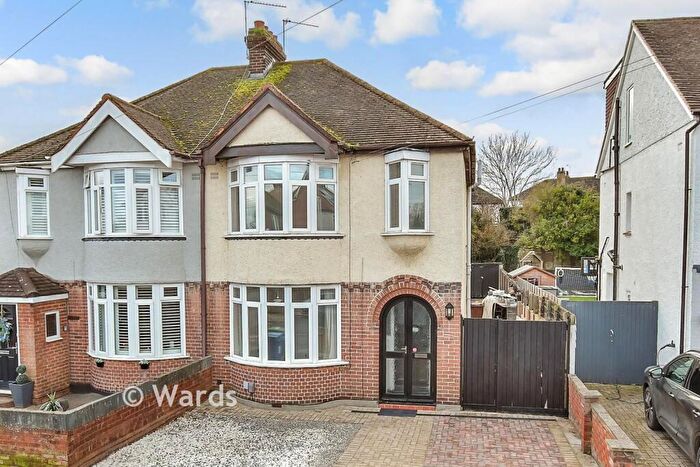
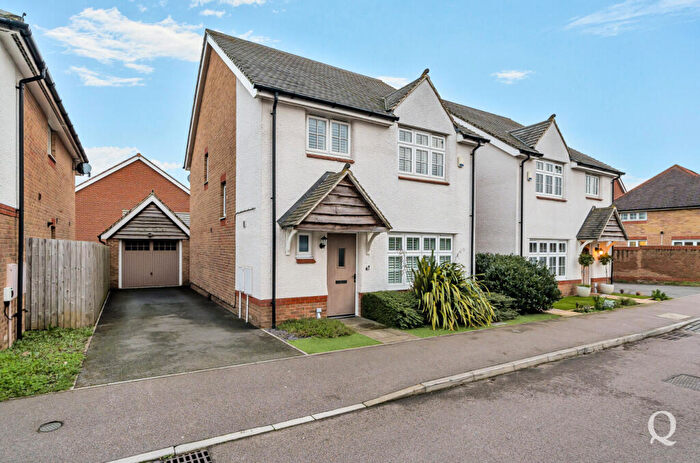
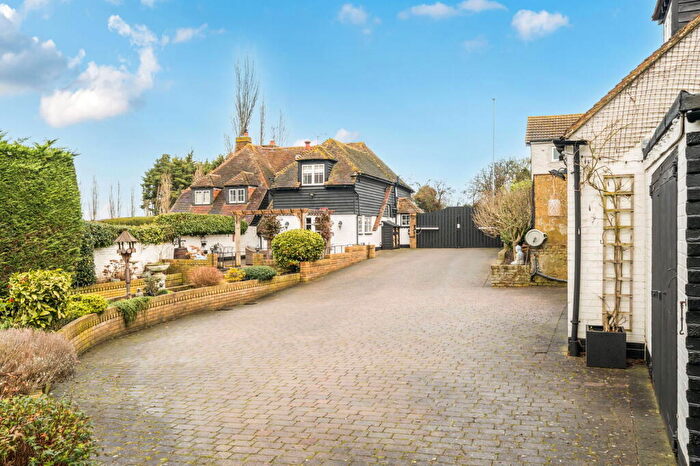
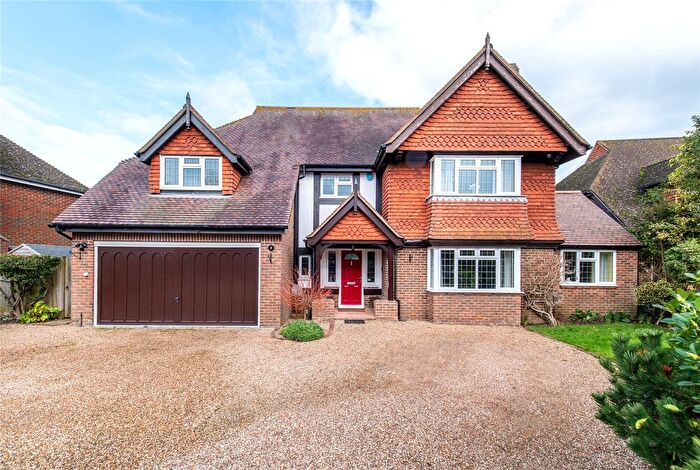
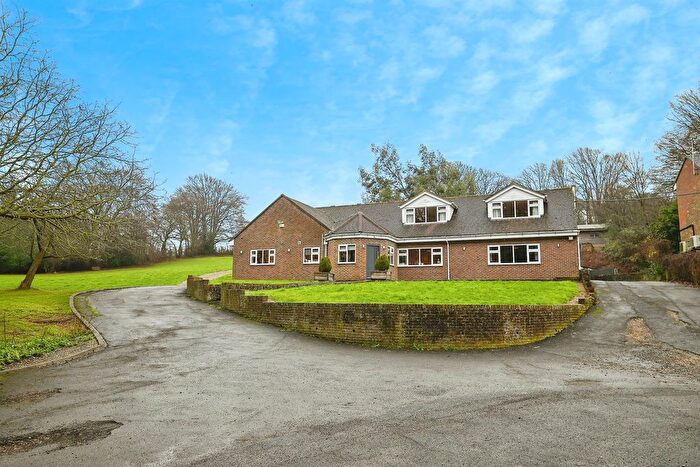
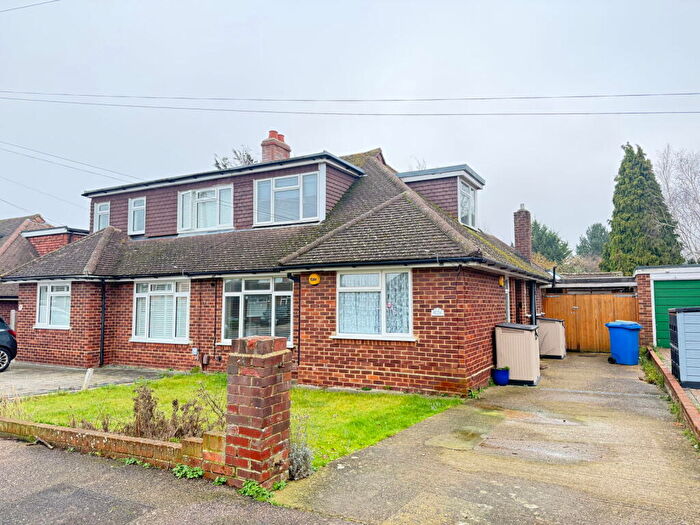
Properties for sale in Borden
Roads and Postcodes in Borden
Navigate through our locations to find the location of your next house in Borden, Sittingbourne for sale or to rent.
| Streets | Postcodes |
|---|---|
| Alexandra Place | ME9 8JU |
| Bannister Hill | ME9 8HT ME9 8HU |
| Barn Close | ME9 8JW |
| Borden Hall Cottages | ME9 8JS |
| Borden Lane | ME9 8HR |
| Brier Road | ME10 1YJ ME10 1YL |
| Cherryfields | ME10 1YP ME10 1YW |
| Chestnut Street | ME9 8BU ME9 8BX ME9 8DA ME9 8DB ME9 8DD ME9 8DE ME9 8DG |
| Chestnut Wood Lane | ME9 8DH |
| Coppins Lane | ME9 8JG |
| Dental Close | ME10 1DT |
| Duvards Place | ME9 8LJ |
| Greenlees Close | ME10 1GE |
| Grove Park Avenue | ME10 1YH |
| Hearts Delight | ME9 8HX ME9 8HZ |
| Homestead View | ME9 8JQ |
| Key Street | ME10 1YU |
| London Road | ME10 1PW |
| Maidstone Road | ME9 7PT ME9 7PY ME9 7QA |
| Maylam Gardens | ME10 1GA ME10 1GB |
| Micketts Gardens | ME10 1GD |
| Mountview | ME9 8JJ ME9 8JL ME9 8JZ |
| Munsgore Lane | ME9 8JT |
| Oad Street | ME9 8JY ME9 8LA ME9 8LB ME9 8LD |
| Oak Close | ME9 7BF |
| Snords Cottages | ME9 7PU |
| Sutton Baron Road | ME9 8LH |
| The Rise | ME9 8HY |
| The Street | ME9 8JH ME9 8JN ME9 8JR |
| Vigo Lane | ME9 8LE ME9 8LG |
| Westfield Gardens | ME9 7PW |
| Wises Lane | ME10 1YN ME10 1YR ME9 8LN ME9 8LP ME9 8LR |
| Woodgate Lane | ME9 7QB |
| Wrens Road | ME9 8JD ME9 8JE |
Transport near Borden
- FAQ
- Price Paid By Year
- Property Type Price
Frequently asked questions about Borden
What is the average price for a property for sale in Borden?
The average price for a property for sale in Borden is £454,987. This amount is 44% higher than the average price in Sittingbourne. There are 1,763 property listings for sale in Borden.
What streets have the most expensive properties for sale in Borden?
The streets with the most expensive properties for sale in Borden are Hearts Delight at an average of £751,666, Borden Lane at an average of £727,500 and Dental Close at an average of £652,500.
What streets have the most affordable properties for sale in Borden?
The streets with the most affordable properties for sale in Borden are The Street at an average of £225,000, Key Street at an average of £238,333 and Mountview at an average of £287,200.
Which train stations are available in or near Borden?
Some of the train stations available in or near Borden are Sittingbourne, Newington and Kemsley.
Property Price Paid in Borden by Year
The average sold property price by year was:
| Year | Average Sold Price | Price Change |
Sold Properties
|
|---|---|---|---|
| 2025 | £429,472 | -18% |
25 Properties |
| 2024 | £507,722 | 17% |
27 Properties |
| 2023 | £420,815 | -1% |
23 Properties |
| 2022 | £423,026 | 1% |
38 Properties |
| 2021 | £419,629 | 17% |
57 Properties |
| 2020 | £346,881 | -4% |
29 Properties |
| 2019 | £361,017 | 8% |
29 Properties |
| 2018 | £331,351 | 1% |
40 Properties |
| 2017 | £329,299 | -6% |
25 Properties |
| 2016 | £348,795 | 16% |
32 Properties |
| 2015 | £292,986 | -6% |
36 Properties |
| 2014 | £311,862 | 13% |
35 Properties |
| 2013 | £270,096 | -1% |
30 Properties |
| 2012 | £274,071 | -8% |
21 Properties |
| 2011 | £295,685 | 21% |
28 Properties |
| 2010 | £234,995 | -9% |
42 Properties |
| 2009 | £255,574 | 11% |
26 Properties |
| 2008 | £228,462 | -22% |
20 Properties |
| 2007 | £279,410 | 10% |
42 Properties |
| 2006 | £250,619 | 6% |
47 Properties |
| 2005 | £234,491 | -9% |
45 Properties |
| 2004 | £255,374 | 25% |
52 Properties |
| 2003 | £190,978 | 6% |
51 Properties |
| 2002 | £180,338 | 4% |
119 Properties |
| 2001 | £173,236 | 6% |
69 Properties |
| 2000 | £162,882 | 29% |
57 Properties |
| 1999 | £114,926 | 8% |
34 Properties |
| 1998 | £105,582 | 19% |
35 Properties |
| 1997 | £85,247 | -8% |
50 Properties |
| 1996 | £92,431 | 11% |
27 Properties |
| 1995 | £82,592 | - |
33 Properties |
Property Price per Property Type in Borden
Here you can find historic sold price data in order to help with your property search.
The average Property Paid Price for specific property types in the last three years are:
| Property Type | Average Sold Price | Sold Properties |
|---|---|---|
| Semi Detached House | £356,759.00 | 27 Semi Detached Houses |
| Detached House | £606,340.00 | 33 Detached Houses |
| Terraced House | £298,821.00 | 15 Terraced Houses |

