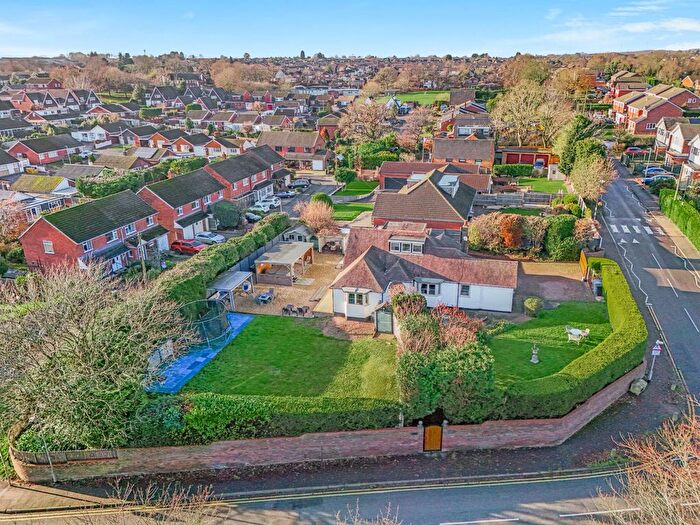
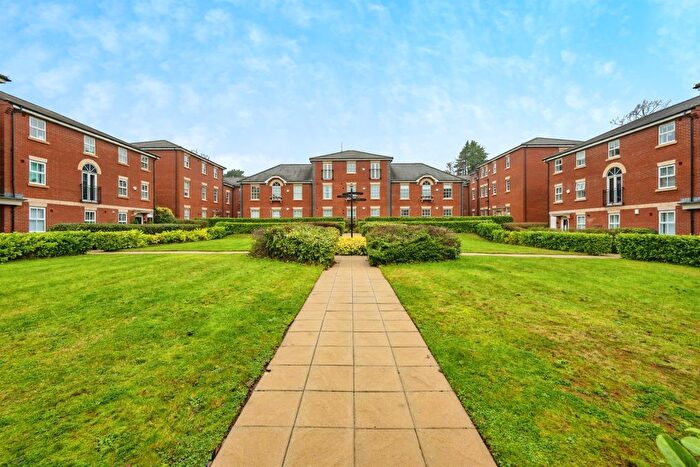
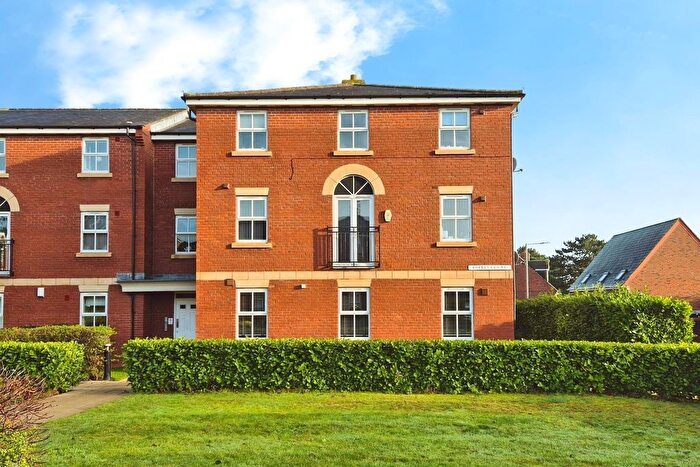
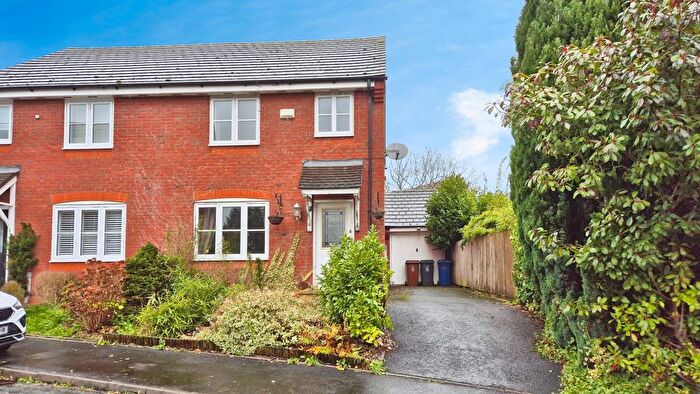
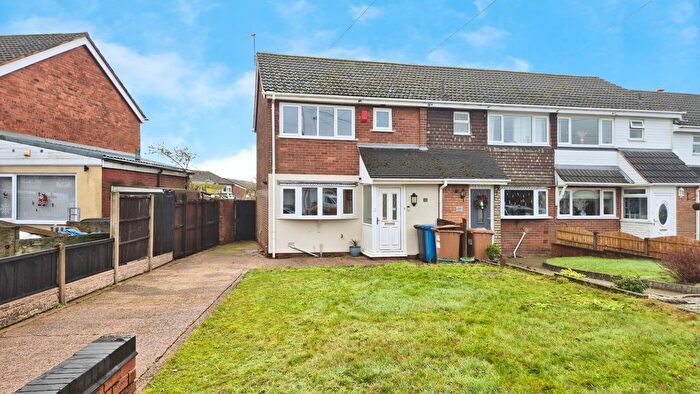
Houses for sale & to rent in Highfield, Burntwood
House Prices in Highfield
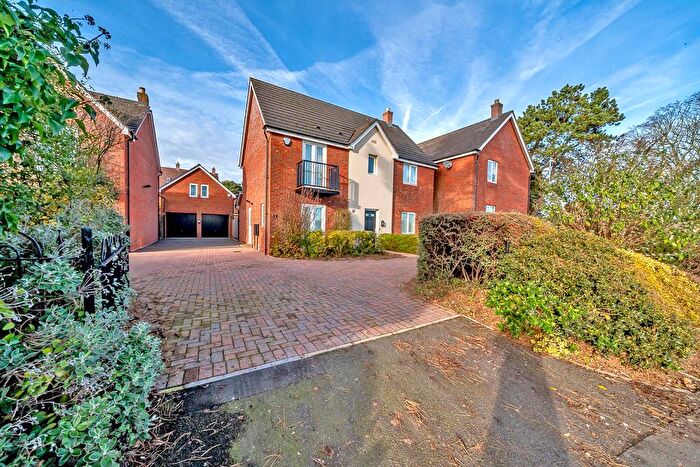
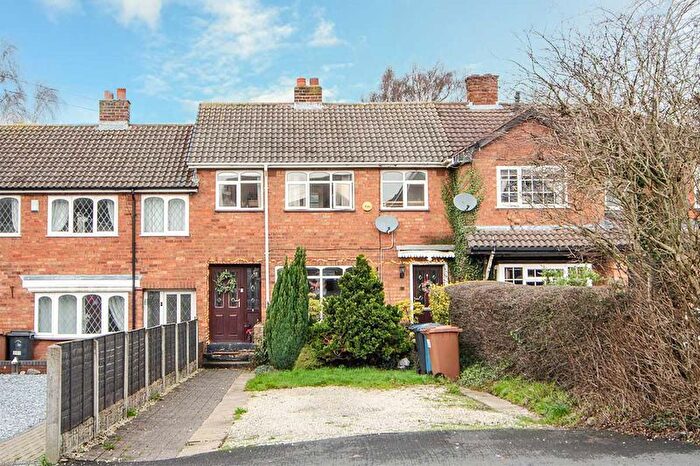
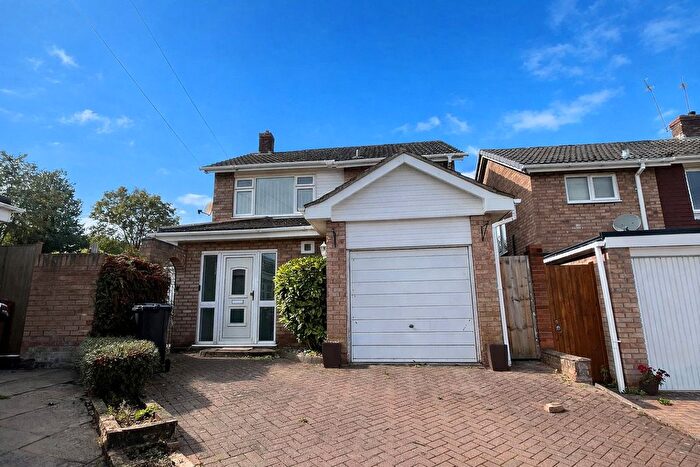
Properties in Highfield have an average house price of £361,991.00 and had 201 Property Transactions within the last 3 years¹.
Highfield is an area in Burntwood, Staffordshire with 1,543 households², where the most expensive property was sold for £830,000.00.
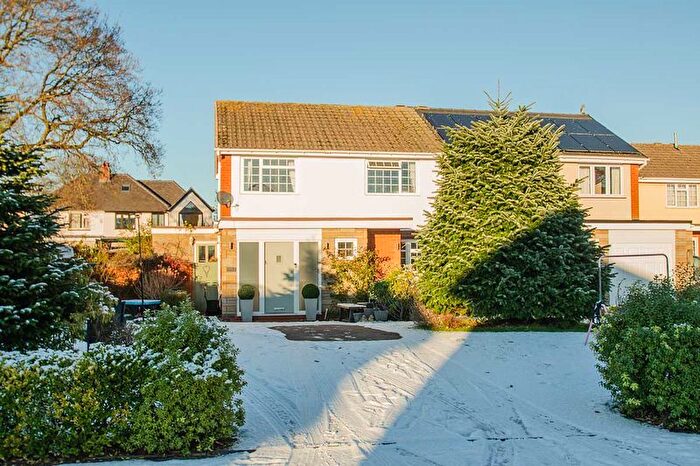
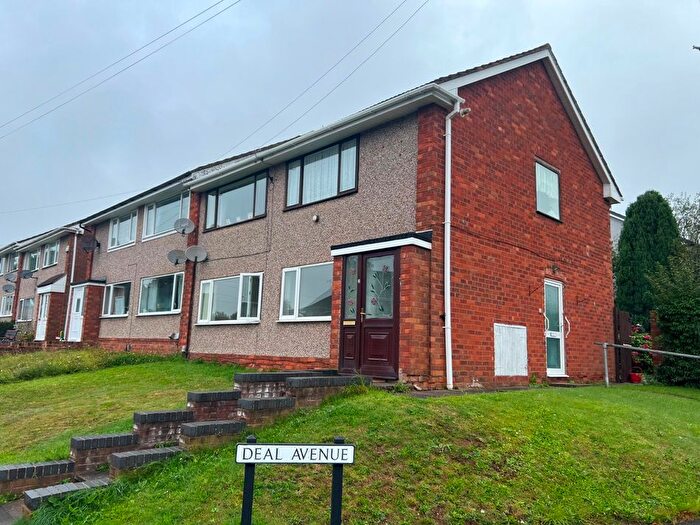
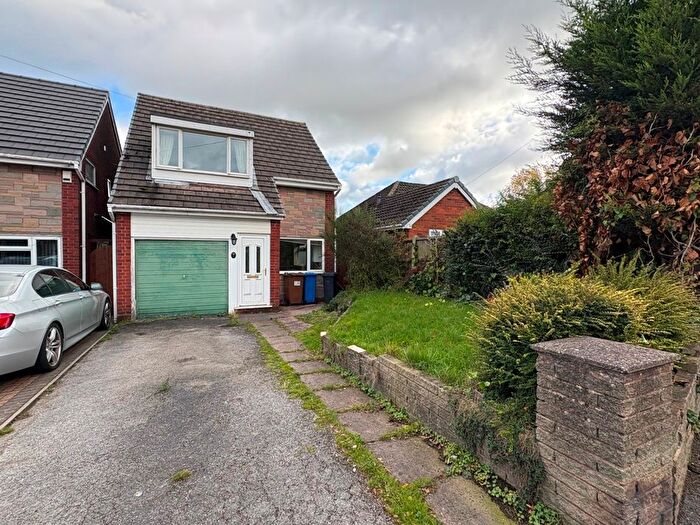
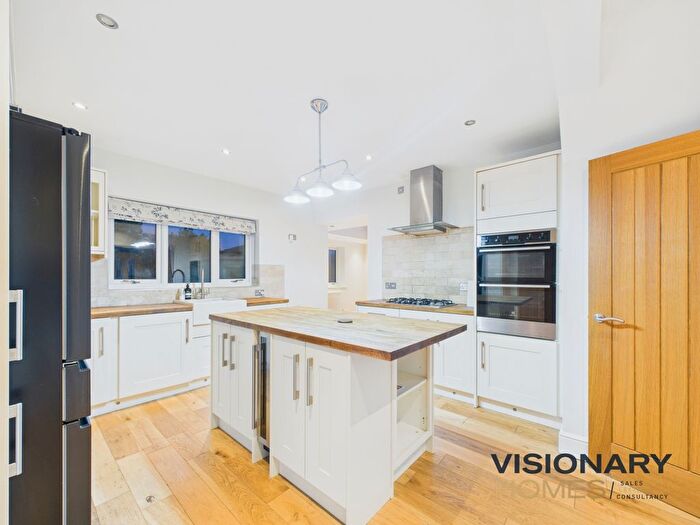
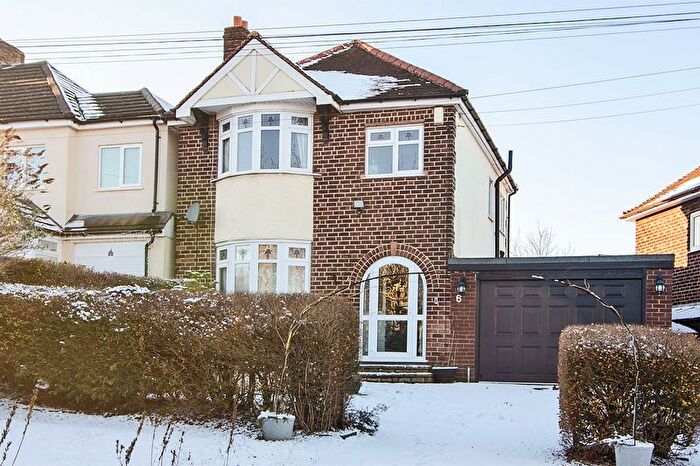
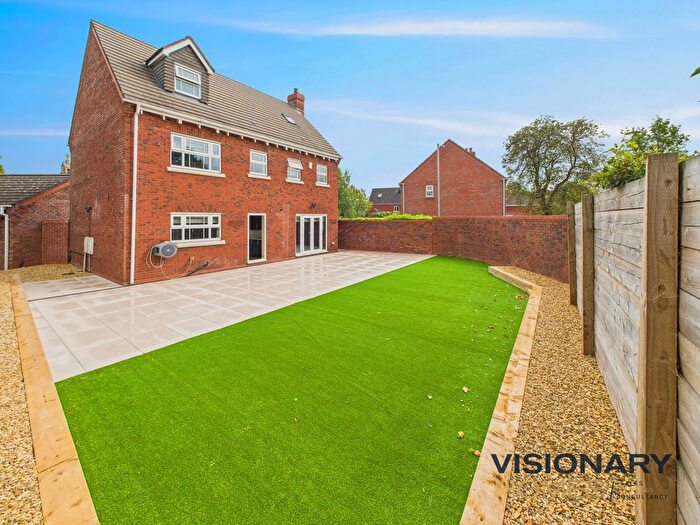
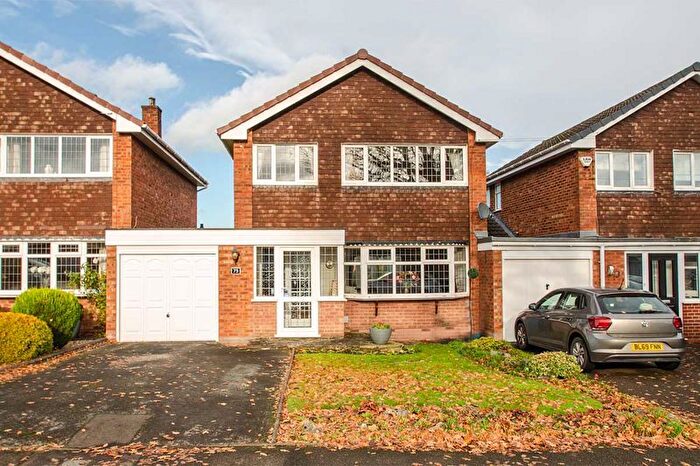
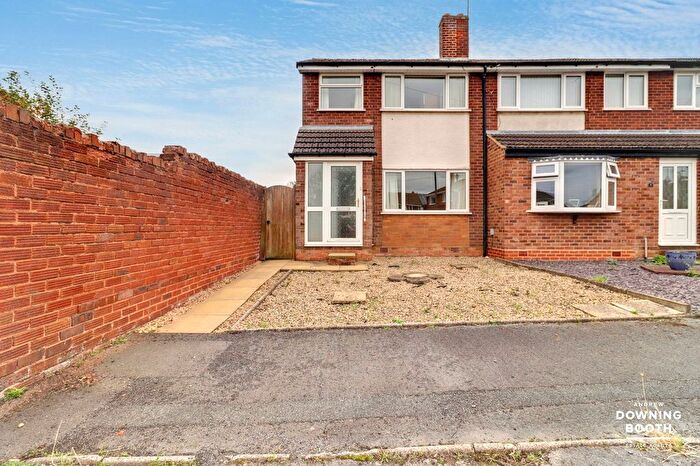
Properties for sale in Highfield
Previously listed properties in Highfield
Roads and Postcodes in Highfield
Navigate through our locations to find the location of your next house in Highfield, Burntwood for sale or to rent.
| Streets | Postcodes |
|---|---|
| Anker Close | WS7 9JW |
| Ashmole Avenue | WS7 9QG |
| Blythe Close | WS7 9JJ |
| Bodington Close | WS7 9QA |
| Boulton Close | WS7 9LD |
| Bramble Lane | WS7 9AU |
| Brunel Close | WS7 9LG |
| Cannock Road | WS7 1LW |
| Canterbury Drive | WS7 9JX |
| Cavell Road | WS7 9QQ |
| Cheshire Close | WS7 9QX |
| Chorley Road | WS7 2PQ |
| Church Road | WS7 9EA WS7 9EB |
| Clegg Road | WS7 9QL |
| Cort Drive | WS7 9LW |
| Coulter Lane | WS7 9DY WS7 9EU WS7 9HN WS7 9DX |
| Creswell Green | WS7 9HL |
| Derwent Grove | WS7 9JN |
| Dove Close | WS7 9JL |
| Fallow Drive | WS7 9ED |
| Farewell Lane | WS7 9DP WS7 9DW |
| Freer Drive | WS7 9QJ |
| Gettings Close | WS7 9QE |
| Glasscroft Cottages | WS7 9DT |
| Green Lane | WS7 9HB |
| Gregory Road | WS7 9QB |
| Hamps Close | WS7 9JU |
| Highfield Road | WS7 9BS WS7 9BY WS7 9DA |
| Hunslet Road | WS7 9LA WS7 9LF |
| Huntsmans Gate | WS7 9LL |
| Jones Lane | WS7 9DS |
| Keble Close | WS7 9BX |
| Kingfisher Court | WS7 9QS |
| Leam Drive | WS7 9JG |
| Lichfield Road | WS7 0HQ WS7 0HX WS7 0HZ WS7 0HY |
| Macadam Close | WS7 9LJ |
| Manifold Close | WS7 9JR |
| Mease Avenue | WS7 9JP |
| Meg Lane | WS7 2PJ WS7 9HE WS7 2PL |
| Metcalf Close | WS7 9LH |
| Mulberry Drive | WS7 9DU |
| Nether Lane | WS7 9EX WS7 9EZ |
| Newcomen Close | WS7 9LE |
| Nightingale Walk | WS7 9QH WS7 9QR WS7 9QT |
| Ogley Vale | WS7 9DL |
| Padbury Lane | WS7 9HJ WS7 9HG WS7 9HH |
| Penk Drive | WS7 9JT |
| Rake Hill | WS7 9DE WS7 9DF WS7 9DQ |
| Reid Close | WS7 9QF |
| Rugeley Road | WS7 9BN WS7 9BW WS7 9HA WS7 9HF WS7 9HQ |
| Sanderling Rise | WS7 9NZ |
| Scholars Gate | WS7 9EE |
| Selwyn Road | WS7 9HU WS7 9QU WS7 9QW |
| Severn Drive | WS7 9JE WS7 9JF |
| Shaftesbury Drive | WS7 9QP |
| Shirelea Close | WS7 9BZ |
| Sister Dora Avenue | WS7 9QD |
| Springle Styche Lane | WS7 9HD |
| Squires Gate | WS7 9DG |
| St Matthews Avenue | WS7 9EW |
| St Matthews Road | WS7 9DR WS7 9EP WS7 9EN |
| Stour Close | WS7 9JY |
| Tame Avenue | WS7 9JQ |
| Tean Close | WS7 9JS |
| Telford Close | WS7 9LQ |
| The Hollies | WS7 9EY |
| Trent Close | WS7 9JH |
| Trevithick Close | WS7 9LB |
| Upfields | WS7 9DZ |
| Wentworth Close | WS7 9BP |
| Westwoods Hollow | WS7 9AT |
| Wilkinson Close | WS7 9LN |
| Woodhouses Road | WS7 9EH WS7 9EJ WS7 9EL |
| Yorkshire Way | WS7 9QY |
Transport near Highfield
- FAQ
- Price Paid By Year
- Property Type Price
Frequently asked questions about Highfield
What is the average price for a property for sale in Highfield?
The average price for a property for sale in Highfield is £361,991. This amount is 37% higher than the average price in Burntwood. There are 747 property listings for sale in Highfield.
What streets have the most expensive properties for sale in Highfield?
The streets with the most expensive properties for sale in Highfield are Fallow Drive at an average of £820,000, Squires Gate at an average of £778,750 and Rake Hill at an average of £653,975.
What streets have the most affordable properties for sale in Highfield?
The streets with the most affordable properties for sale in Highfield are Kingfisher Court at an average of £143,500, St Matthews Avenue at an average of £189,375 and St Matthews Road at an average of £194,000.
Which train stations are available in or near Highfield?
Some of the train stations available in or near Highfield are Lichfield City, Shenstone and Lichfield Trent Valley.
Property Price Paid in Highfield by Year
The average sold property price by year was:
| Year | Average Sold Price | Price Change |
Sold Properties
|
|---|---|---|---|
| 2025 | £407,655 | 8% |
29 Properties |
| 2024 | £375,526 | 12% |
48 Properties |
| 2023 | £330,769 | -8% |
49 Properties |
| 2022 | £356,071 | -4% |
75 Properties |
| 2021 | £371,700 | 6% |
77 Properties |
| 2020 | £350,759 | 14% |
54 Properties |
| 2019 | £300,520 | 1% |
49 Properties |
| 2018 | £298,770 | -15% |
50 Properties |
| 2017 | £342,750 | 18% |
58 Properties |
| 2016 | £279,510 | -5% |
66 Properties |
| 2015 | £292,950 | 14% |
65 Properties |
| 2014 | £251,079 | 8% |
70 Properties |
| 2013 | £229,851 | 3% |
44 Properties |
| 2012 | £222,848 | -13% |
37 Properties |
| 2011 | £251,346 | 14% |
30 Properties |
| 2010 | £215,592 | -7% |
36 Properties |
| 2009 | £230,069 | -16% |
34 Properties |
| 2008 | £267,649 | 1% |
26 Properties |
| 2007 | £264,942 | 22% |
81 Properties |
| 2006 | £206,642 | -8% |
78 Properties |
| 2005 | £223,548 | -1% |
92 Properties |
| 2004 | £226,680 | 21% |
120 Properties |
| 2003 | £180,025 | 11% |
150 Properties |
| 2002 | £159,352 | -0,2% |
157 Properties |
| 2001 | £159,726 | 16% |
97 Properties |
| 2000 | £134,513 | 27% |
76 Properties |
| 1999 | £98,183 | -1% |
57 Properties |
| 1998 | £98,678 | -0,3% |
41 Properties |
| 1997 | £98,987 | 7% |
60 Properties |
| 1996 | £92,409 | 19% |
74 Properties |
| 1995 | £74,796 | - |
43 Properties |
Property Price per Property Type in Highfield
Here you can find historic sold price data in order to help with your property search.
The average Property Paid Price for specific property types in the last three years are:
| Property Type | Average Sold Price | Sold Properties |
|---|---|---|
| Semi Detached House | £313,757.00 | 33 Semi Detached Houses |
| Detached House | £448,541.00 | 112 Detached Houses |
| Terraced House | £267,063.00 | 33 Terraced Houses |
| Flat | £145,934.00 | 23 Flats |

