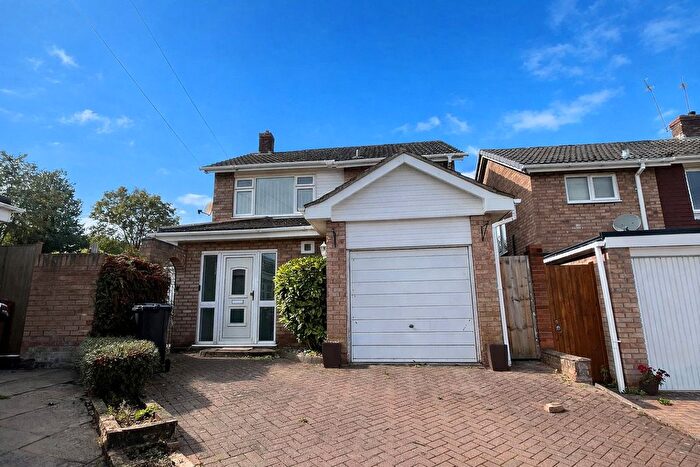
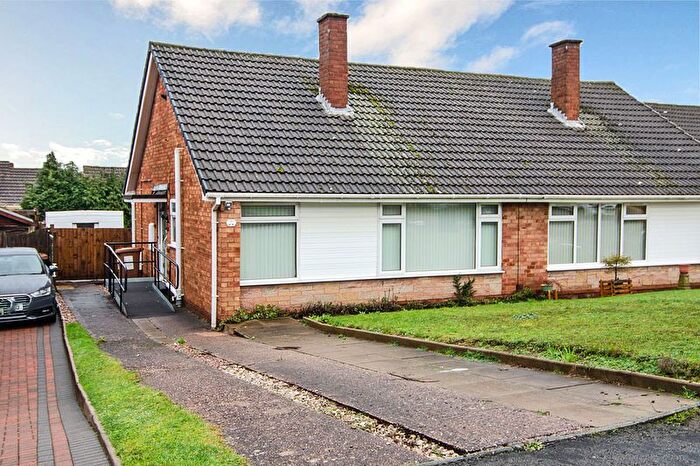
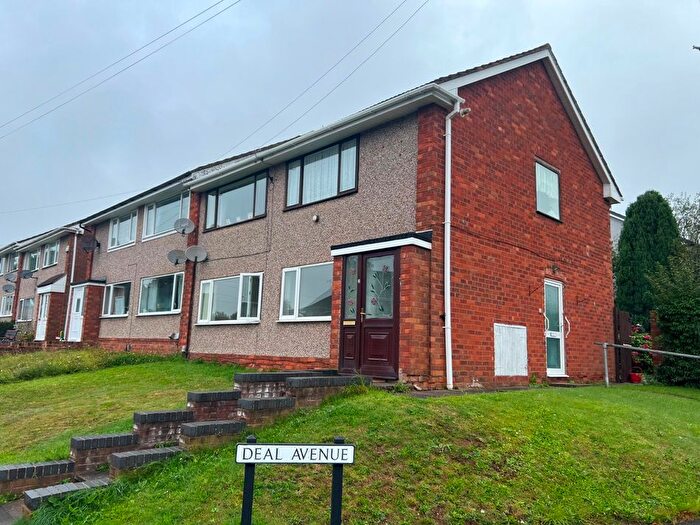
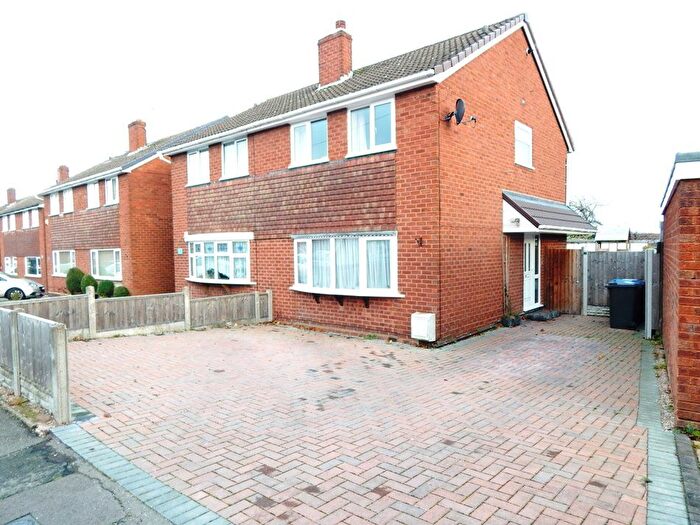
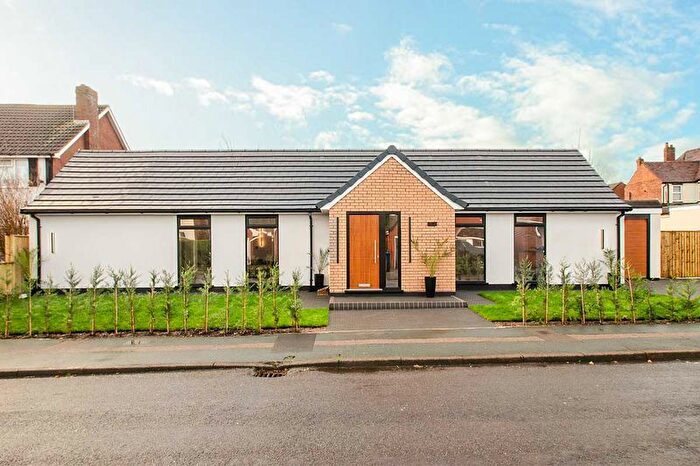
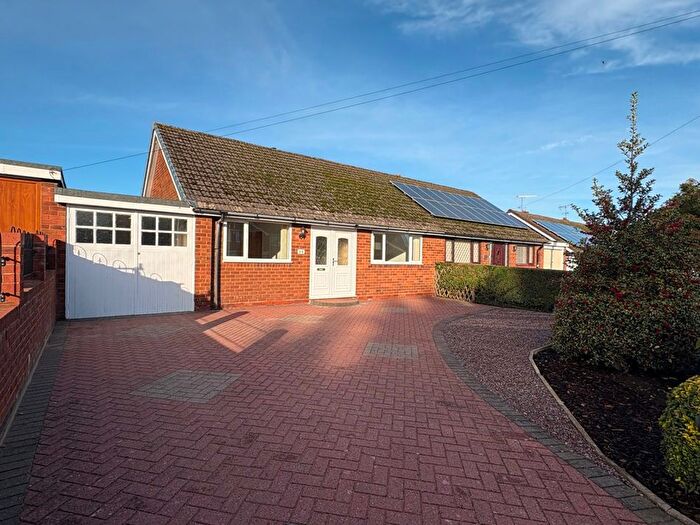
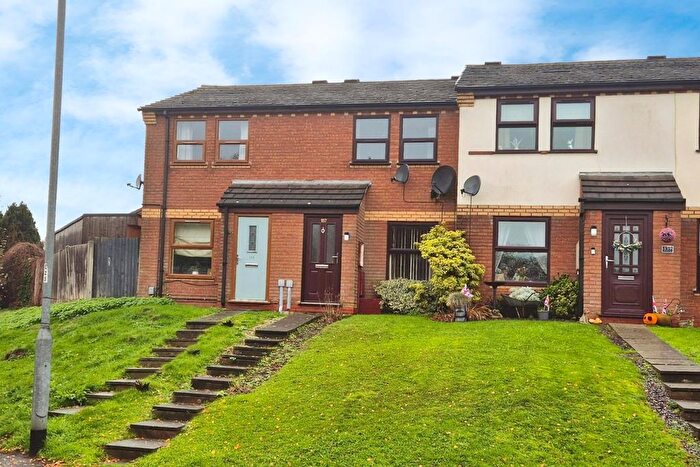
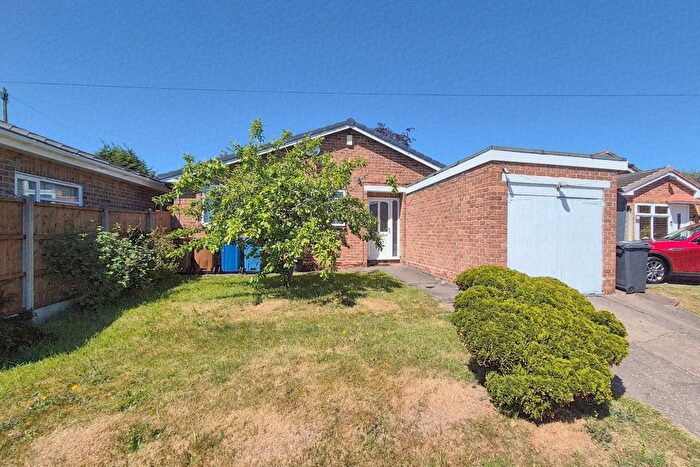
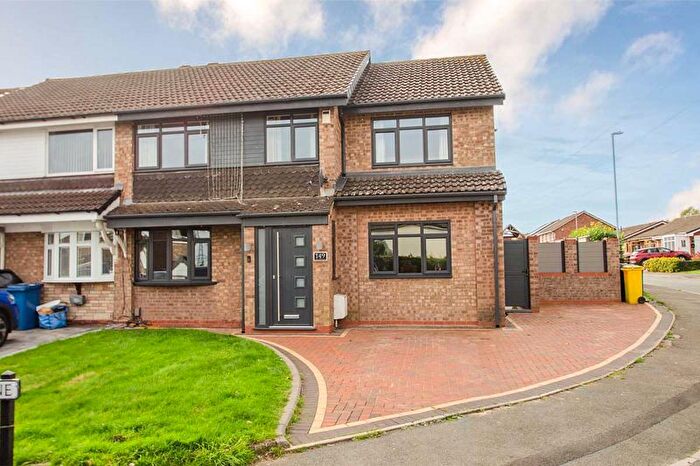
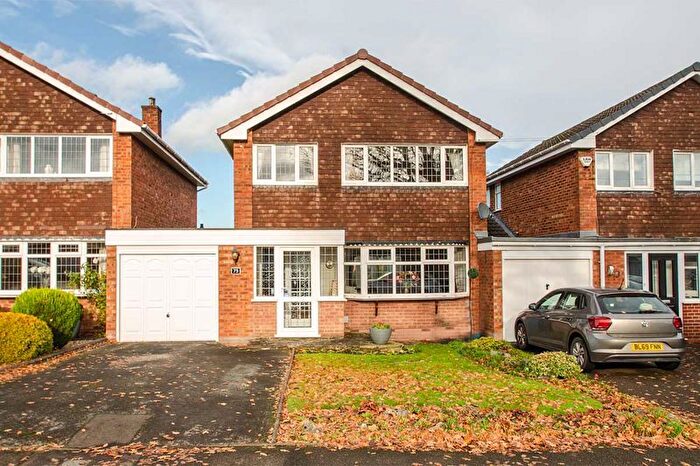
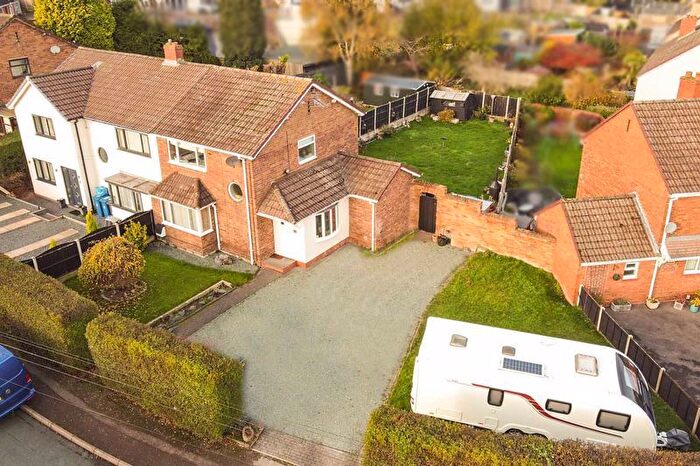
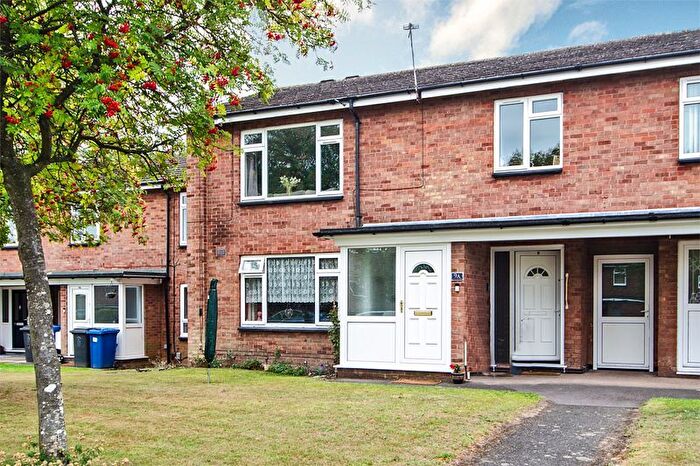
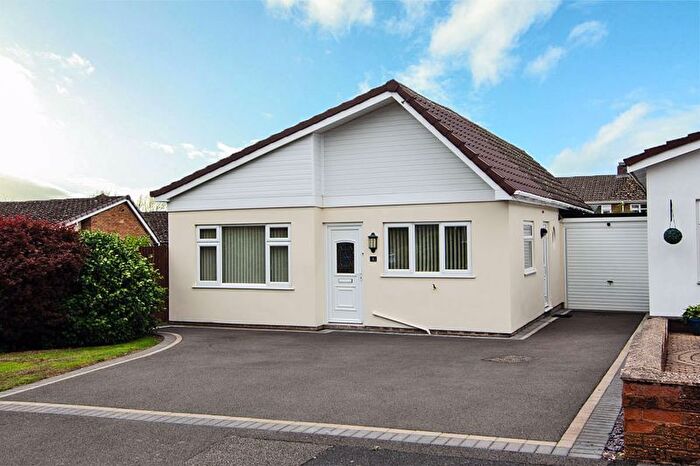
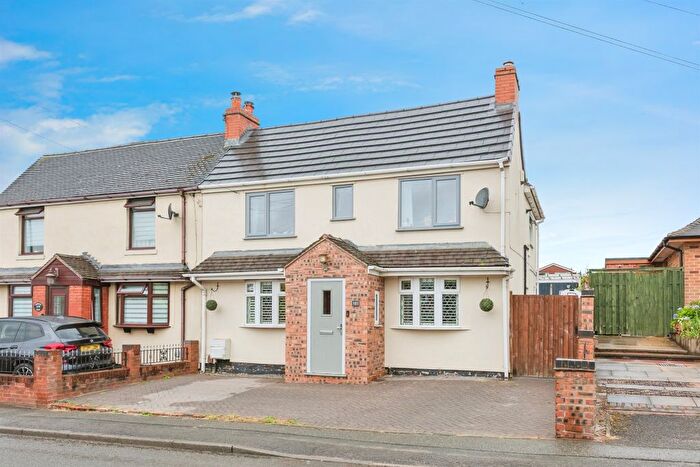
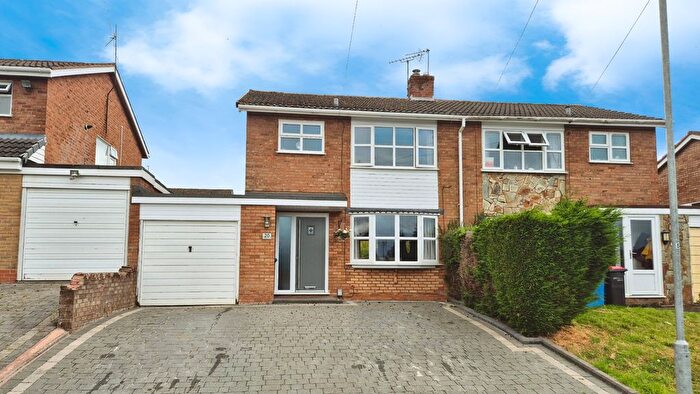
Houses for sale & to rent in Boney Hay, Burntwood
House Prices in Boney Hay
Properties in Boney Hay have an average house price of £244,206.00 and had 81 Property Transactions within the last 3 years¹.
Boney Hay is an area in Burntwood, Staffordshire with 1,297 households², where the most expensive property was sold for £515,000.00.
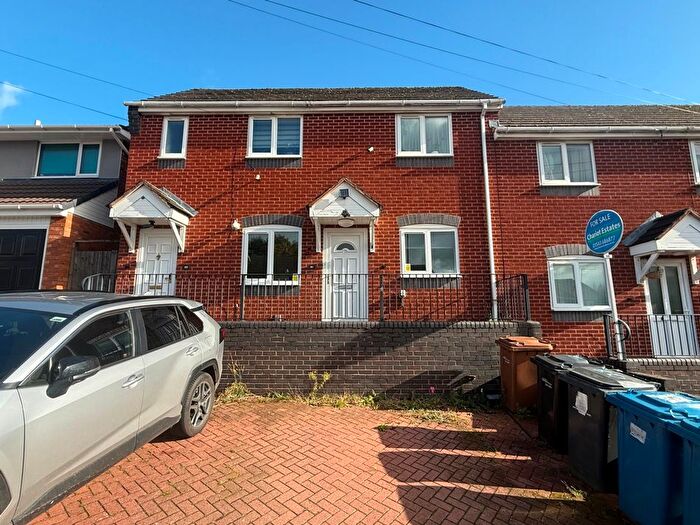
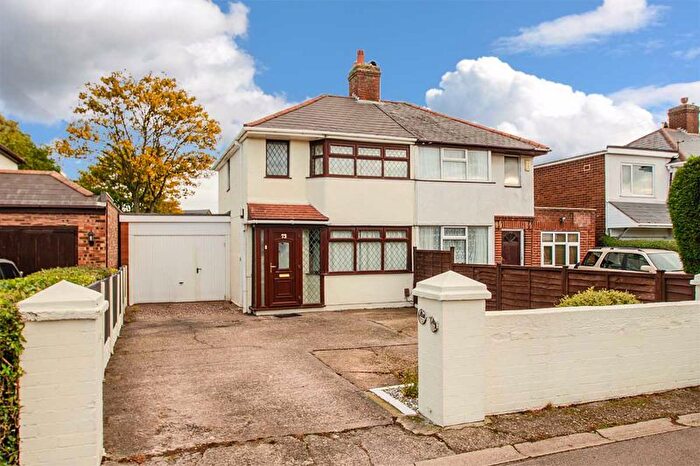
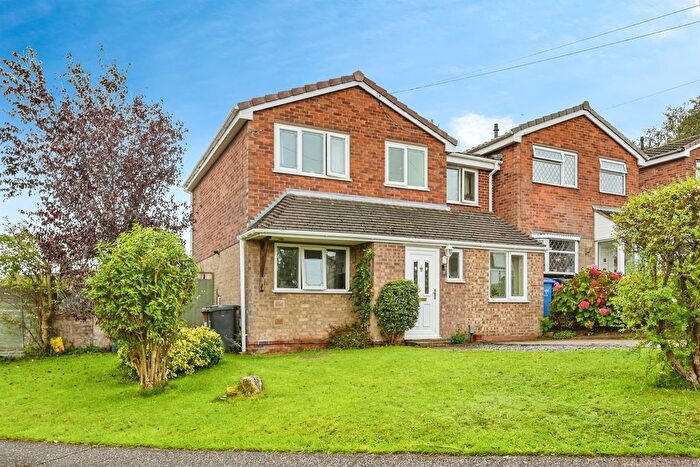
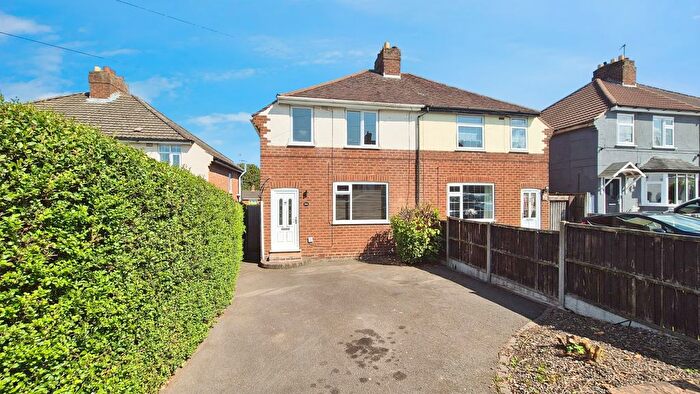
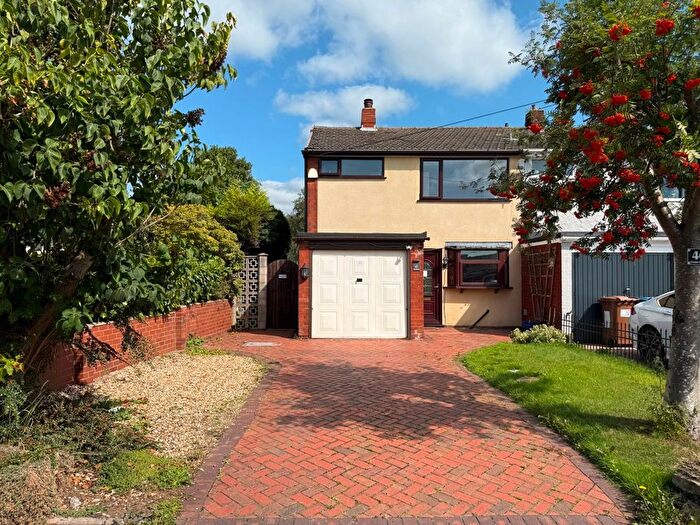
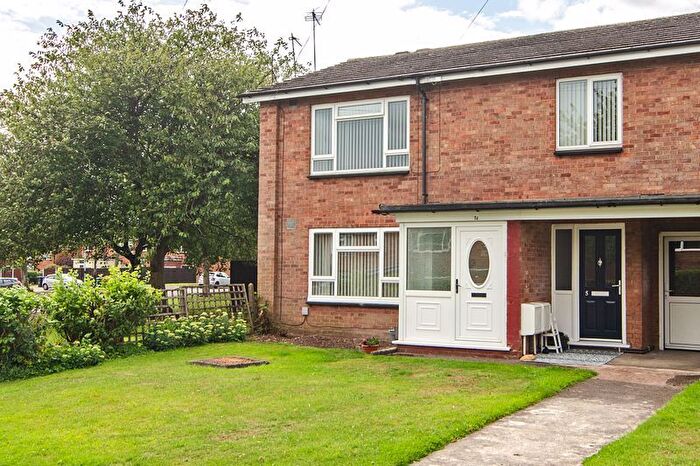
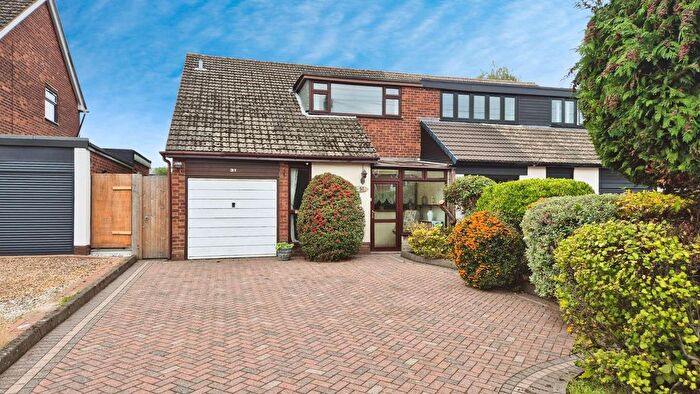
Properties for sale in Boney Hay
Previously listed properties in Boney Hay
Roads and Postcodes in Boney Hay
Navigate through our locations to find the location of your next house in Boney Hay, Burntwood for sale or to rent.
| Streets | Postcodes |
|---|---|
| Acorn Close | WS7 2HQ |
| Albion Way | WS7 2NW |
| Beaudesert | WS7 2JD |
| Bells Lane | WS7 2PD |
| Birch Terrace | WS7 2HH WS7 2HJ |
| Blenheim Road | WS7 2HZ |
| Brackenhill Road | WS7 2HY |
| Byron Close | WS7 2EX |
| Chaucer Drive | WS7 2HT |
| Chorley Road | WS7 2NU WS7 2NX WS7 2PF |
| Common View | WS7 2JF |
| Coppice Close | WS7 2BJ |
| Cotton Way | WS7 2NN |
| Croft Gardens | WS7 2EZ |
| Deal Avenue | WS7 2EU |
| Fernleigh Avenue | WS7 2ES |
| Heath View | WS7 2BF |
| Johnson Road | WS7 2NL |
| Kipling Avenue | WS7 2HS |
| Longfellow Road | WS7 2EY |
| Lymington Road | WS7 2YT |
| Masefield Close | WS7 2HW |
| May Close | WS7 2PE |
| North Street | WS7 2PB |
| Oak Lane | WS7 2HD WS7 2HE WS7 2HF WS7 2HG |
| Ogley Hay Road | WS7 2HU WS7 2HX WS7 2PH WS7 9DD |
| Parkhill Road | WS7 2ER WS7 2ET |
| Robinson Road | WS7 2LN |
| Rugeley Road | WS7 1NR WS7 1NS WS7 1NT |
| Ryecroft Drive | WS7 2JA |
| Sandown Close | WS7 2YU |
| Scott Way | WS7 2NP |
| Shakespeare Road | WS7 2LW |
| Shaw Drive | WS7 2JE |
| Shelley Road | WS7 2HR |
| Slade Avenue | WS7 2EE WS7 2EL |
| Spinney Close | WS7 2GW |
| Spinney Lane | WS7 2HA WS7 2HB |
| Squirrels Hollow | WS7 2YS |
| Sunnymead Road | WS7 2LL |
| Tennyson Avenue | WS7 2HL |
| The Crescent | WS7 2PA |
| The Croft | WS7 2HP |
| Thornfield Crescent | WS7 2JB |
| Wordsworth Road | WS7 2HN |
Transport near Boney Hay
-
Hednesford Station
-
Cannock Station
-
Lichfield City Station
-
Landywood Station
-
Rugeley Town Station
-
Shenstone Station
- FAQ
- Price Paid By Year
- Property Type Price
Frequently asked questions about Boney Hay
What is the average price for a property for sale in Boney Hay?
The average price for a property for sale in Boney Hay is £244,206. This amount is 8% lower than the average price in Burntwood. There are 501 property listings for sale in Boney Hay.
What streets have the most expensive properties for sale in Boney Hay?
The streets with the most expensive properties for sale in Boney Hay are Spinney Close at an average of £385,000, Squirrels Hollow at an average of £370,625 and Shaw Drive at an average of £317,000.
What streets have the most affordable properties for sale in Boney Hay?
The streets with the most affordable properties for sale in Boney Hay are Longfellow Road at an average of £113,500, Johnson Road at an average of £120,000 and Cotton Way at an average of £125,000.
Which train stations are available in or near Boney Hay?
Some of the train stations available in or near Boney Hay are Hednesford, Cannock and Lichfield City.
Property Price Paid in Boney Hay by Year
The average sold property price by year was:
| Year | Average Sold Price | Price Change |
Sold Properties
|
|---|---|---|---|
| 2025 | £282,456 | 15% |
23 Properties |
| 2024 | £239,505 | 8% |
26 Properties |
| 2023 | £220,534 | -7% |
32 Properties |
| 2022 | £235,809 | 1% |
43 Properties |
| 2021 | £233,435 | 7% |
35 Properties |
| 2020 | £217,395 | 12% |
34 Properties |
| 2019 | £190,507 | -9% |
33 Properties |
| 2018 | £207,551 | 22% |
38 Properties |
| 2017 | £160,894 | -4% |
34 Properties |
| 2016 | £166,602 | 9% |
40 Properties |
| 2015 | £151,563 | -3% |
38 Properties |
| 2014 | £156,850 | 5% |
30 Properties |
| 2013 | £149,495 | 10% |
26 Properties |
| 2012 | £135,028 | -8% |
16 Properties |
| 2011 | £146,433 | 3% |
24 Properties |
| 2010 | £142,706 | 11% |
24 Properties |
| 2009 | £127,062 | -9% |
24 Properties |
| 2008 | £138,013 | -21% |
18 Properties |
| 2007 | £167,150 | 19% |
33 Properties |
| 2006 | £135,390 | -14% |
44 Properties |
| 2005 | £154,446 | 19% |
38 Properties |
| 2004 | £125,002 | 15% |
41 Properties |
| 2003 | £106,461 | 9% |
52 Properties |
| 2002 | £96,427 | 22% |
55 Properties |
| 2001 | £75,343 | 12% |
44 Properties |
| 2000 | £66,590 | 7% |
47 Properties |
| 1999 | £62,196 | 6% |
34 Properties |
| 1998 | £58,185 | -8% |
43 Properties |
| 1997 | £62,858 | 20% |
29 Properties |
| 1996 | £50,543 | -27% |
46 Properties |
| 1995 | £64,244 | - |
48 Properties |
Property Price per Property Type in Boney Hay
Here you can find historic sold price data in order to help with your property search.
The average Property Paid Price for specific property types in the last three years are:
| Property Type | Average Sold Price | Sold Properties |
|---|---|---|
| Semi Detached House | £220,467.00 | 29 Semi Detached Houses |
| Detached House | £323,714.00 | 28 Detached Houses |
| Terraced House | £201,621.00 | 18 Terraced Houses |
| Flat | £115,666.00 | 6 Flats |

