
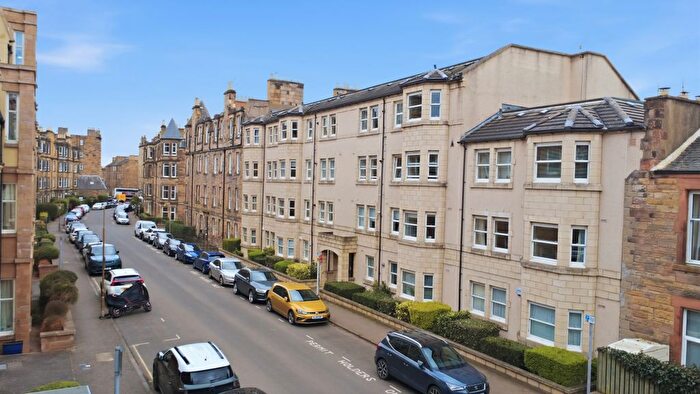
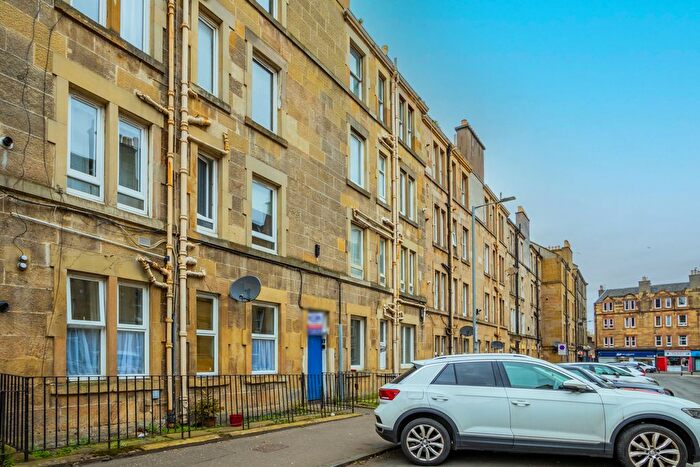
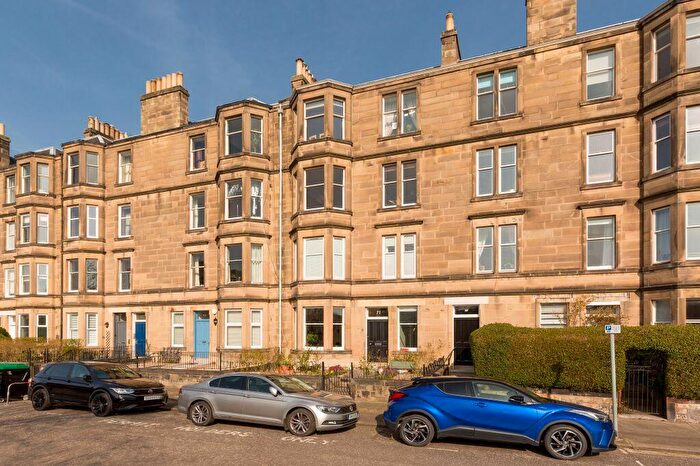
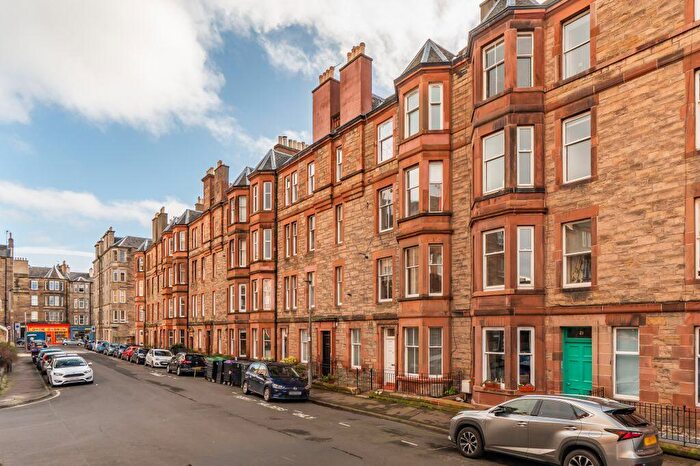
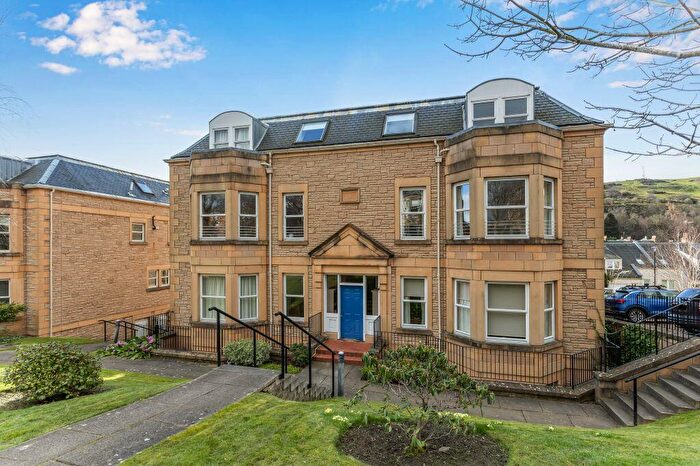
Houses for sale & to rent in Morningside, Edinburgh
House Prices in Morningside
Properties in Morningside have an average house price of £604k and had 463 Property Transactions within the last 3 years¹.
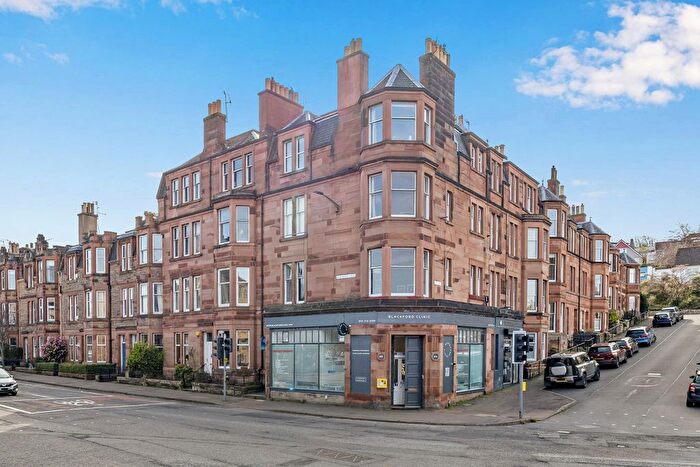
Morningside is an area in Edinburgh, City of Edinburgh with 13,841 households², where the most expensive property was sold for £5.96M.
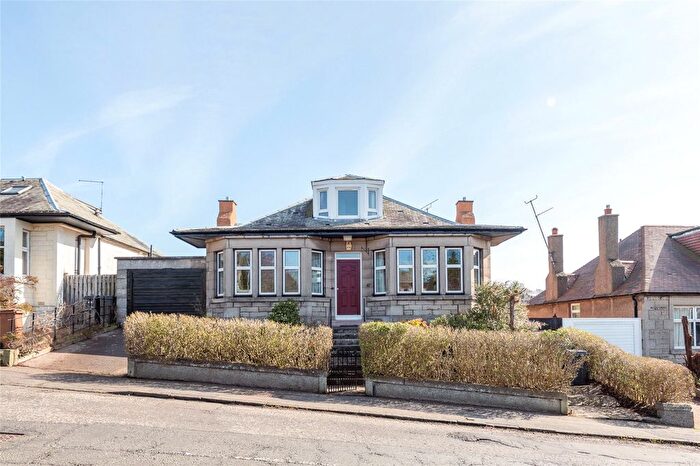
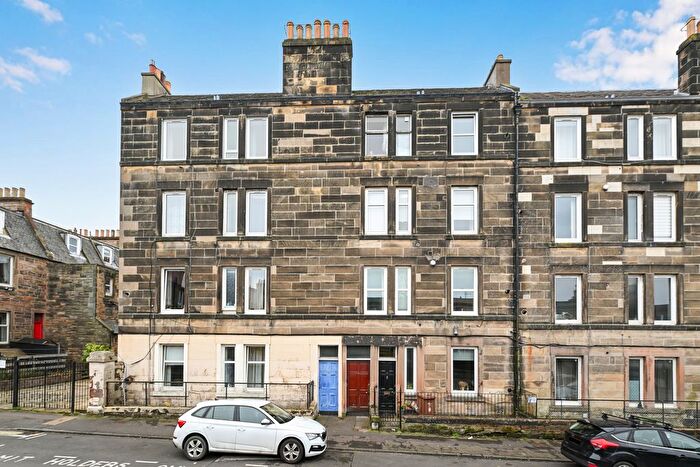
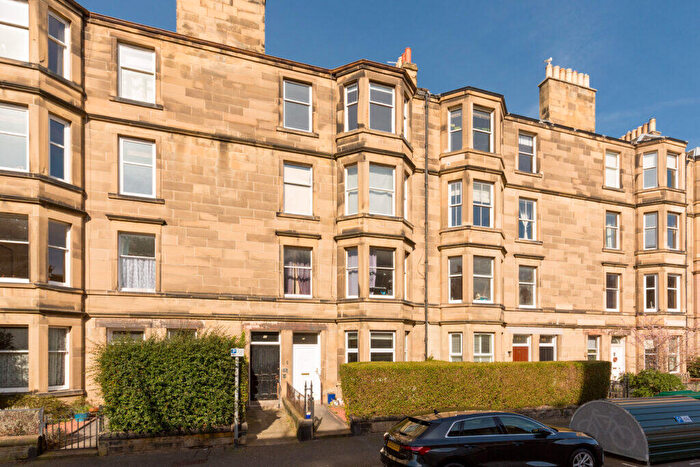
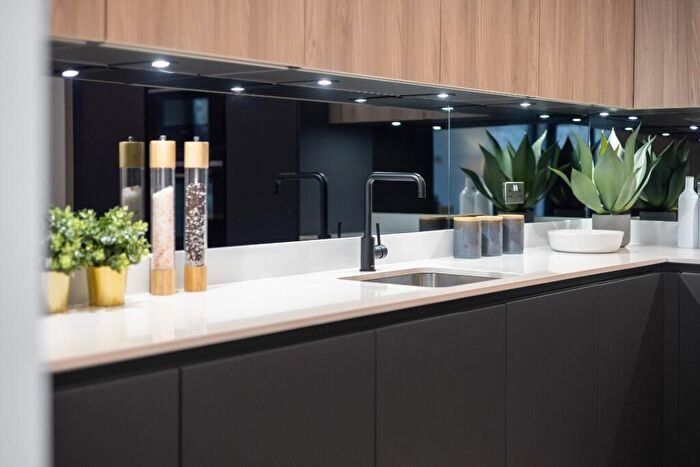
Properties for sale in Morningside

![]()
If you are looking to sell your house, let it out, or receive a property valuation, an expert can help you.
Click the button below to get started.


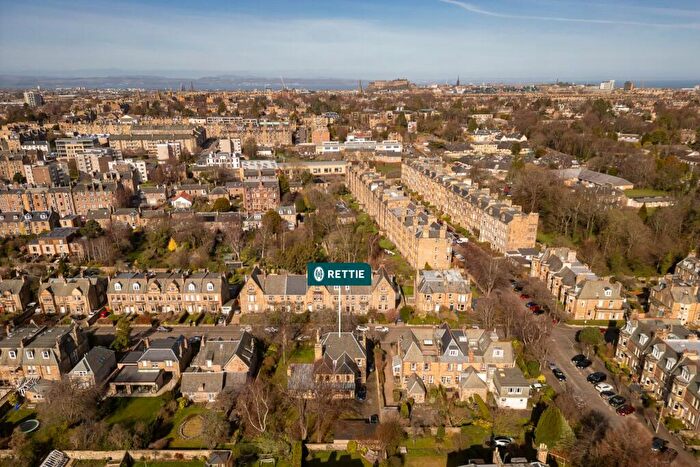
Roads and Postcodes in Morningside
Navigate through our locations to find the location of your next house in Morningside, Edinburgh for sale or to rent.
Transport near Morningside

- FAQ
- Price Paid By Year
Frequently asked questions about Morningside
What is the average price for a property for sale in Morningside?
The average price for a property for sale in Morningside is £604,079. This amount is 57% higher than the average price in Edinburgh. There are 5,538 property listings for sale in Morningside.
What streets have the most expensive properties for sale in Morningside?
The streets with the most expensive properties for sale in Morningside are Ettrick Road at an average of £4,355,000, Greenhill Gardens at an average of £2,650,000 and Midmar Gardens at an average of £1,571,607.
What streets have the most affordable properties for sale in Morningside?
The streets with the most affordable properties for sale in Morningside are Balcarres Court at an average of £234,154, Morningside Court at an average of £243,750 and Springvalley Terrace at an average of £253,300.
Which train stations are available in or near Morningside?
Some of the train stations available in or near Morningside are Haymarket, Slateford and Edinburgh.
Property Price Paid in Morningside by Year
The average sold property price by year was:
| Year | Average Sold Price | Price Change |
Sold Properties
|
|---|---|---|---|
| 2025 | £691,468 | 14% |
137 Properties |
| 2024 | £592,003 | 7% |
142 Properties |
| 2023 | £548,333 | 10% |
184 Properties |
| 2022 | £492,538 | 10% |
611 Properties |
| 2021 | £440,900 | -7% |
727 Properties |
| 2020 | £472,057 | 10% |
457 Properties |
| 2019 | £423,622 | 2% |
626 Properties |
| 2018 | £413,238 | 9% |
597 Properties |
| 2017 | £376,643 | 6% |
627 Properties |
| 2016 | £355,509 | 3% |
688 Properties |
| 2015 | £343,412 | 6% |
819 Properties |
| 2014 | £322,912 | 5% |
739 Properties |
| 2013 | £306,753 | -0,5% |
727 Properties |
| 2012 | £308,156 | -6% |
591 Properties |
| 2011 | £326,042 | -3% |
562 Properties |
| 2010 | £336,890 | 7% |
552 Properties |
| 2009 | £313,828 | 1% |
512 Properties |
| 2008 | £311,384 | -8% |
604 Properties |
| 2007 | £335,537 | 13% |
824 Properties |
| 2006 | £292,005 | 0,3% |
932 Properties |
| 2005 | £291,071 | 19% |
878 Properties |
| 2004 | £236,872 | 3% |
1,010 Properties |
| 2003 | £229,655 | 16% |
983 Properties |
| 2002 | £192,830 | 20% |
1,038 Properties |
| 2001 | £153,967 | 10% |
127 Properties |
| 2000 | £138,932 | - |
54 Properties |