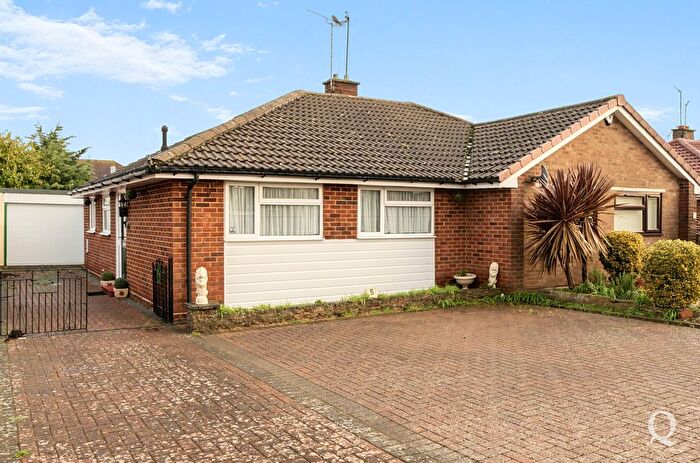
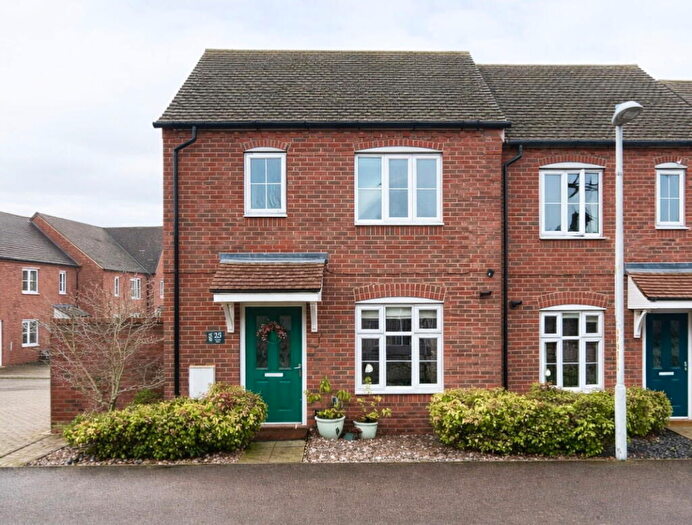
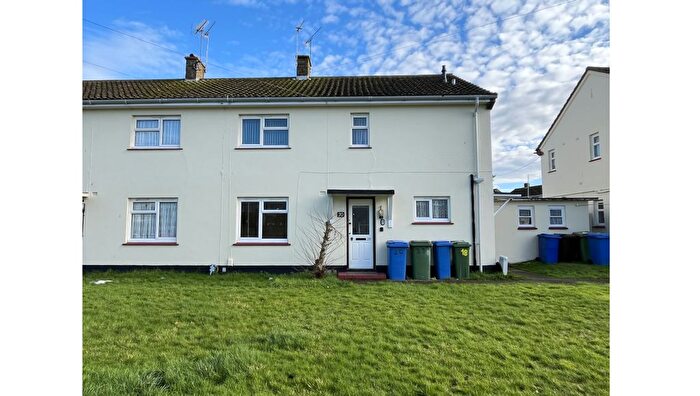
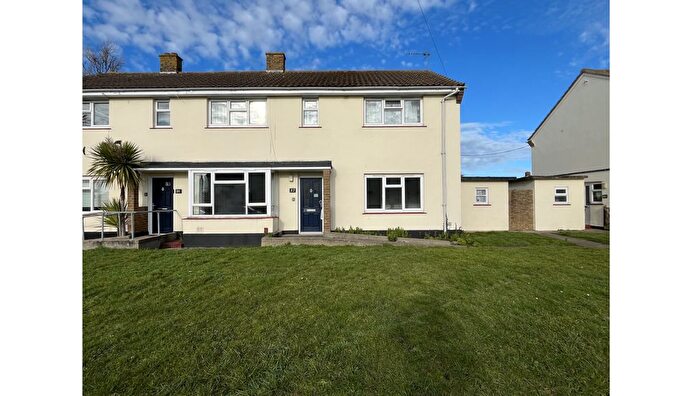
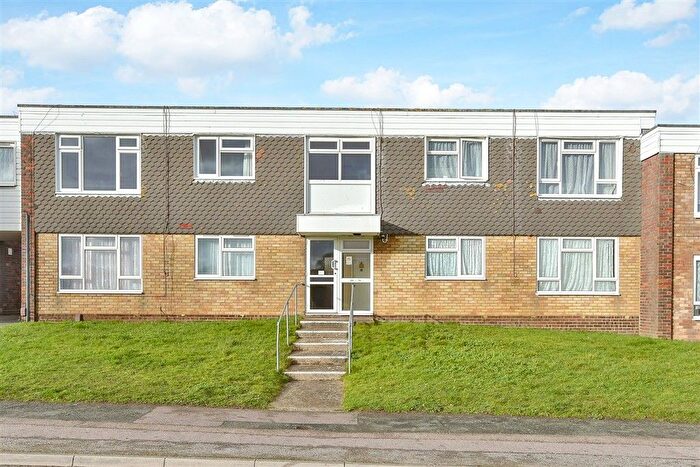
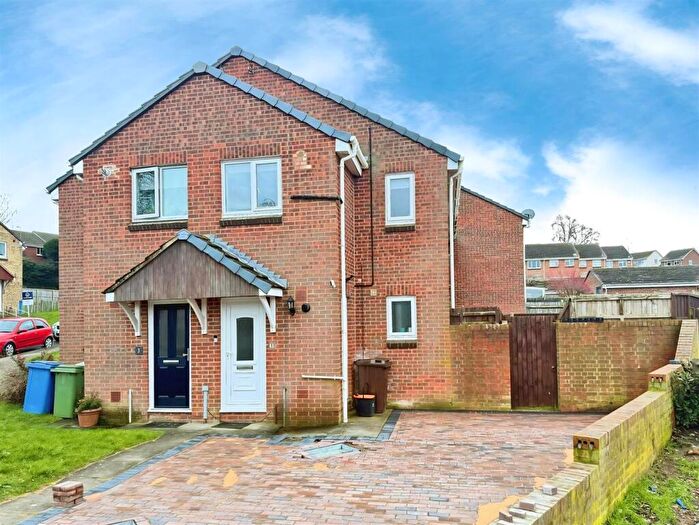
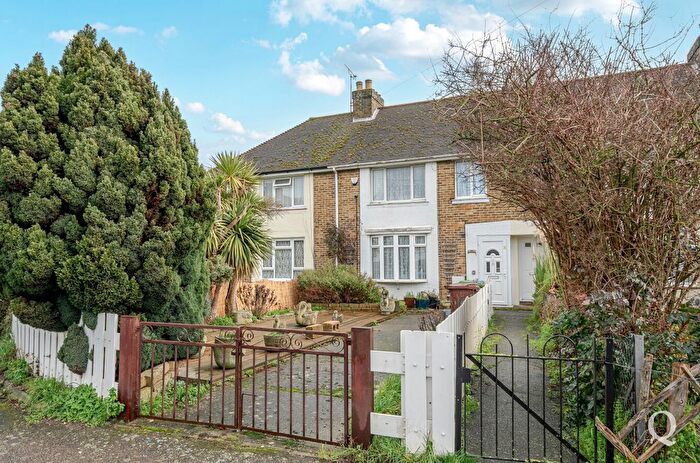
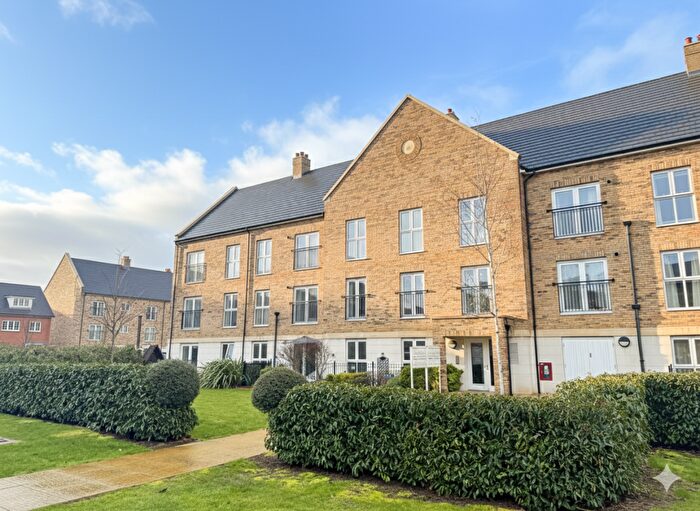
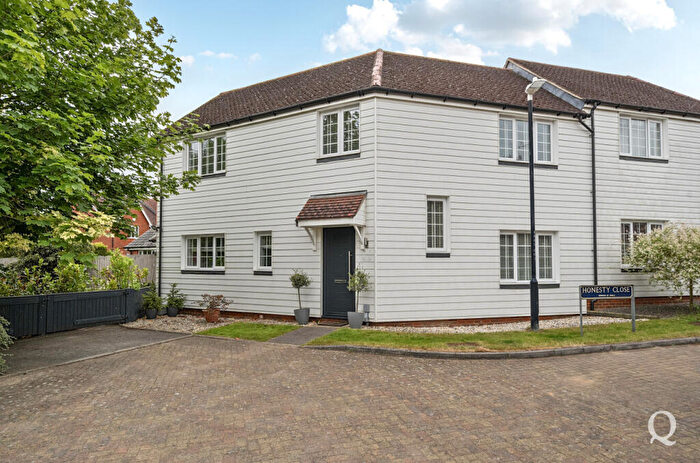
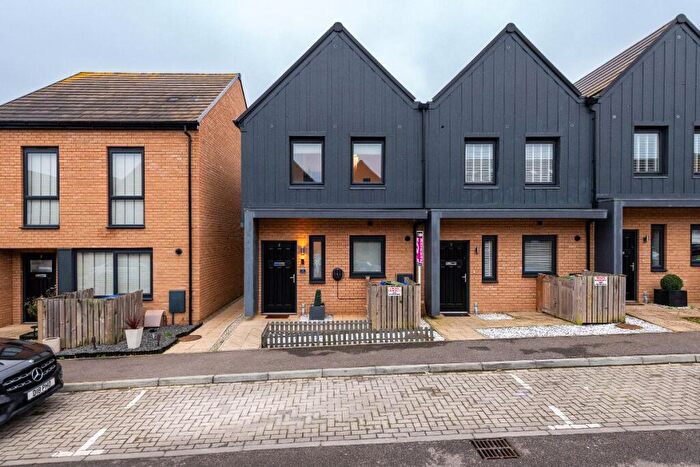
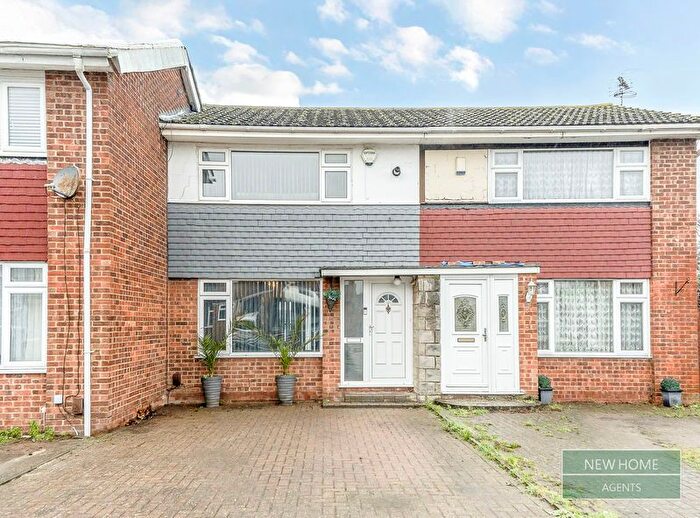
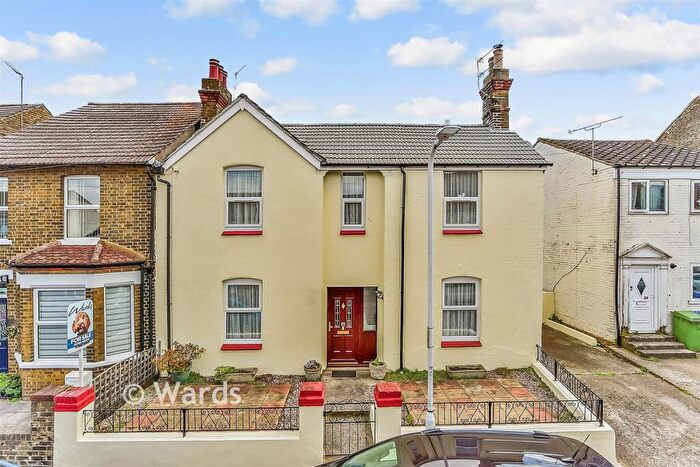
Houses for sale & to rent in Roman, Sittingbourne
House Prices in Roman
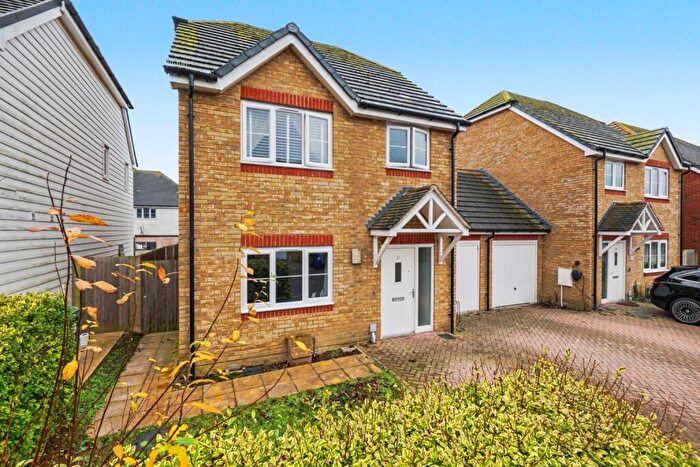
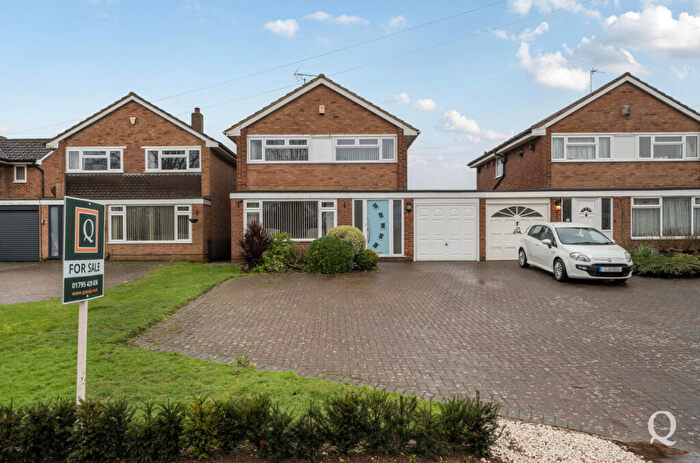
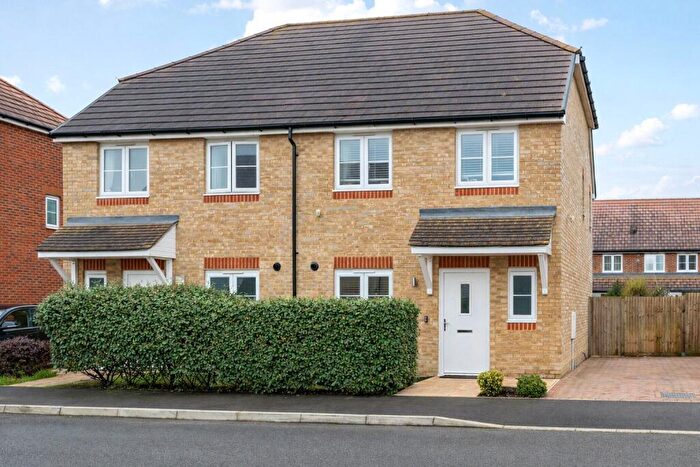
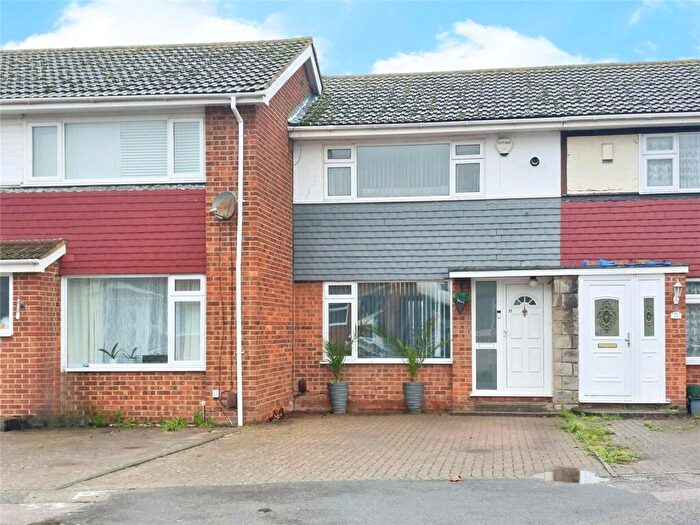
Properties in Roman have an average house price of £251,657.00 and had 229 Property Transactions within the last 3 years¹.
Roman is an area in Sittingbourne, Kent with 2,240 households², where the most expensive property was sold for £475,000.00.
Properties for sale in Roman
Roads and Postcodes in Roman
Navigate through our locations to find the location of your next house in Roman, Sittingbourne for sale or to rent.
| Streets | Postcodes |
|---|---|
| Bayford Road | ME10 3AD |
| Bell Road | ME10 4DJ |
| Blenheim Road | ME10 4LT |
| Britannia Lane | TN23 3SU |
| Caldew Grove | ME10 4SL |
| Cambridge Road | ME10 4NB |
| Canterbury Road | ME10 4JD ME10 4JE ME10 4SD ME10 4SG ME10 4SN ME10 4UA ME10 4UF ME10 4FD |
| Cedar Close | ME10 4JU |
| Centre 2000 | ME10 3DZ |
| Commonwealth Close | ME10 4UB |
| Cowper Road | ME10 3AL |
| Crown Quay Lane | ME10 3HZ |
| Dalewood | ME10 4UU |
| East Street | ME10 4BT ME10 4RX ME10 3HT ME10 4BG ME10 4FA ME10 4RU ME10 9SB |
| Fairleas | ME10 4LS |
| Fairview Road | ME10 4FB ME10 4FF ME10 4FG ME10 4FJ ME10 4TF |
| Fallowfield | ME10 4UT ME10 4UZ |
| Fulston Place | ME10 4SX |
| Gaze Hill Avenue | ME10 4SA ME10 4SH ME10 4SJ |
| Glebe Lane | ME10 4JS ME10 4JT ME10 4JY |
| Goodnestone Road | ME10 3AF ME10 3AQ |
| Greenways | ME10 4UE |
| Harold Road | ME10 3AH ME10 3AJ |
| Harrier Drive | ME10 4UY |
| Harvey Drive | ME10 4UR |
| Kingsnorth Road | TN23 6LY |
| Longridge | ME10 4LH ME10 4LL ME10 4LN ME10 4LW ME10 4LX |
| Merlin Close | ME10 4TY |
| Middleway | ME10 4NG |
| Muddy Lane | ME10 4LU |
| Nutfields | ME10 4JJ ME10 4JP |
| Orchard Place | ME10 4SS |
| Osprey Court | ME10 4UX |
| Penn Close | ME10 4LP |
| Peregrine Drive | ME10 4TZ ME10 4UG ME10 4UP ME10 4UQ ME10 4UW ME10 4UN |
| Prince Charles Avenue | ME10 4NA ME10 4NJ ME10 4NH |
| Rectory Road | ME10 4JH ME10 4JR ME10 4LB ME10 4UD |
| Rosewood Place | ME10 4FH |
| School Road | ME10 4SE |
| Shakespeare Road | ME10 3AB |
| Shortlands Road | ME10 3JS ME10 3JT ME10 3JU ME10 3JX |
| South Avenue | ME10 4SR ME10 4SU |
| St Johns Avenue | ME10 4NE ME10 4ND |
| St Michaels Road | ME10 3DE |
| Step Style | ME10 4LJ |
| Swanstree Avenue | ME10 4LF ME10 4LG ME10 4NL ME10 4NW |
| Temple Gardens | ME10 4JX |
| Terrace Road | ME10 4SF |
| The Burrs | ME10 4TG |
| The Limes | TN23 3NY |
| Thomas Road | ME10 3AN ME10 3AW |
| Wadham Place | ME10 4LZ |
| Warren Close | ME10 4LR |
| Watling Place | ME10 4ST |
| West Lane | ME10 3BZ |
| Woodlands Road | ME10 4SP |
| TN23 3JG |
Transport near Roman
- FAQ
- Price Paid By Year
- Property Type Price
Frequently asked questions about Roman
What is the average price for a property for sale in Roman?
The average price for a property for sale in Roman is £251,657. This amount is 20% lower than the average price in Sittingbourne. There are more than 10,000 property listings for sale in Roman.
What streets have the most expensive properties for sale in Roman?
The streets with the most expensive properties for sale in Roman are Harvey Drive at an average of £400,000, Dalewood at an average of £395,000 and Fairleas at an average of £328,000.
What streets have the most affordable properties for sale in Roman?
The streets with the most affordable properties for sale in Roman are Rosewood Place at an average of £119,500, Fairview Road at an average of £140,000 and Commonwealth Close at an average of £164,166.
Which train stations are available in or near Roman?
Some of the train stations available in or near Roman are Sittingbourne, Teynham and Kemsley.
Property Price Paid in Roman by Year
The average sold property price by year was:
| Year | Average Sold Price | Price Change |
Sold Properties
|
|---|---|---|---|
| 2025 | £264,093 | 8% |
64 Properties |
| 2024 | £243,120 | -4% |
98 Properties |
| 2023 | £252,263 | -4% |
67 Properties |
| 2022 | £262,065 | 14% |
88 Properties |
| 2021 | £226,603 | 3% |
84 Properties |
| 2020 | £220,623 | 9% |
67 Properties |
| 2019 | £200,906 | -4% |
97 Properties |
| 2018 | £209,778 | 11% |
91 Properties |
| 2017 | £186,101 | -2% |
75 Properties |
| 2016 | £189,211 | 17% |
99 Properties |
| 2015 | £157,960 | 8% |
85 Properties |
| 2014 | £144,601 | 10% |
71 Properties |
| 2013 | £130,073 | 1% |
77 Properties |
| 2012 | £129,122 | 1% |
50 Properties |
| 2011 | £127,851 | 2% |
59 Properties |
| 2010 | £125,876 | 2% |
47 Properties |
| 2009 | £123,451 | -7% |
46 Properties |
| 2008 | £132,507 | -6% |
50 Properties |
| 2007 | £140,749 | 3% |
121 Properties |
| 2006 | £136,820 | 10% |
136 Properties |
| 2005 | £123,283 | 9% |
118 Properties |
| 2004 | £112,092 | 6% |
112 Properties |
| 2003 | £105,396 | 12% |
110 Properties |
| 2002 | £92,560 | 25% |
111 Properties |
| 2001 | £68,971 | 14% |
140 Properties |
| 2000 | £59,507 | 9% |
121 Properties |
| 1999 | £54,422 | 10% |
124 Properties |
| 1998 | £49,084 | 3% |
105 Properties |
| 1997 | £47,537 | 9% |
107 Properties |
| 1996 | £43,096 | -3% |
82 Properties |
| 1995 | £44,443 | - |
99 Properties |
Property Price per Property Type in Roman
Here you can find historic sold price data in order to help with your property search.
The average Property Paid Price for specific property types in the last three years are:
| Property Type | Average Sold Price | Sold Properties |
|---|---|---|
| Semi Detached House | £286,350.00 | 55 Semi Detached Houses |
| Detached House | £357,166.00 | 21 Detached Houses |
| Terraced House | £244,448.00 | 116 Terraced Houses |
| Flat | £162,802.00 | 37 Flats |

