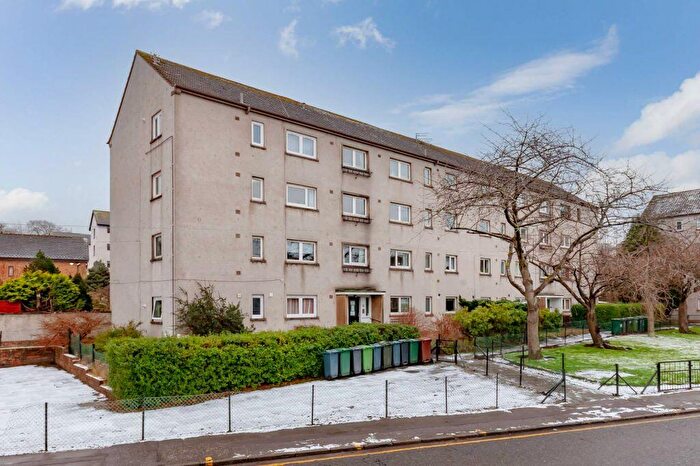
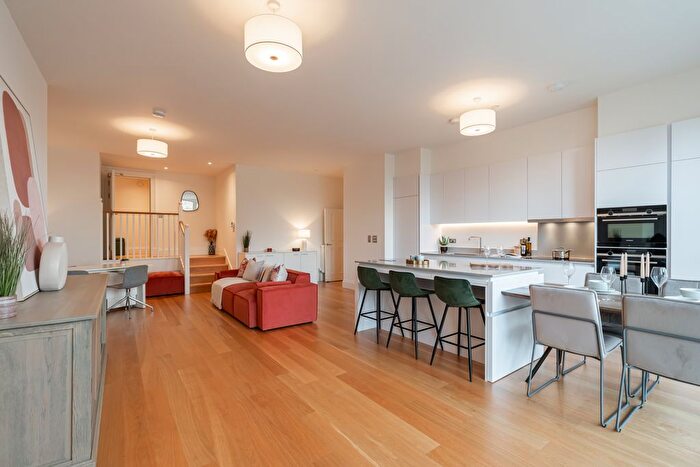
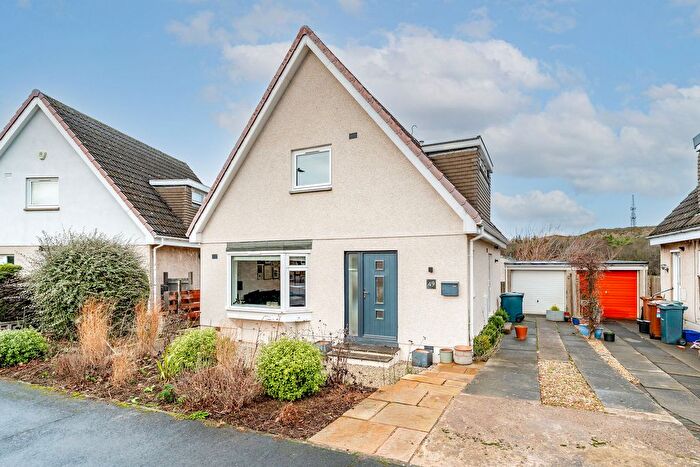
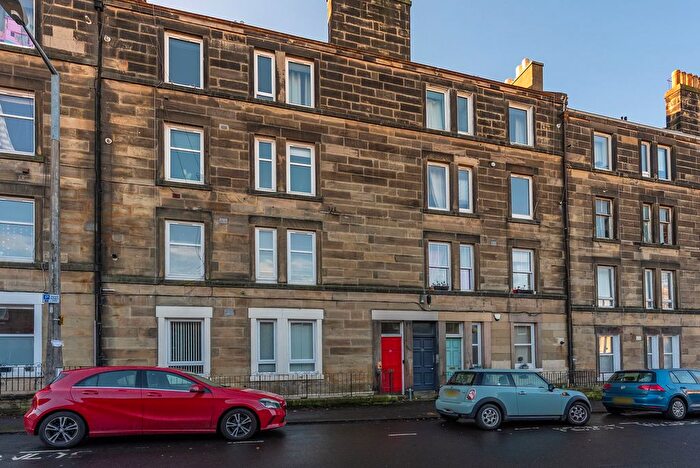
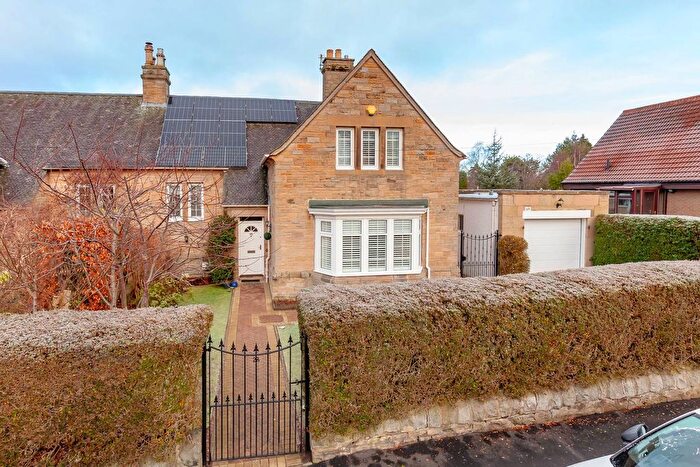
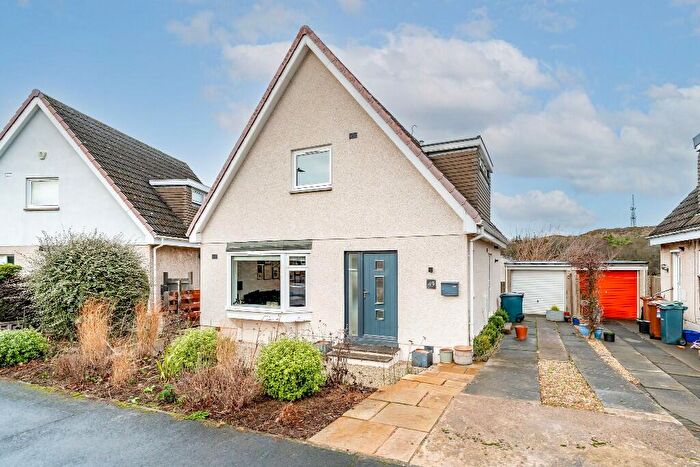
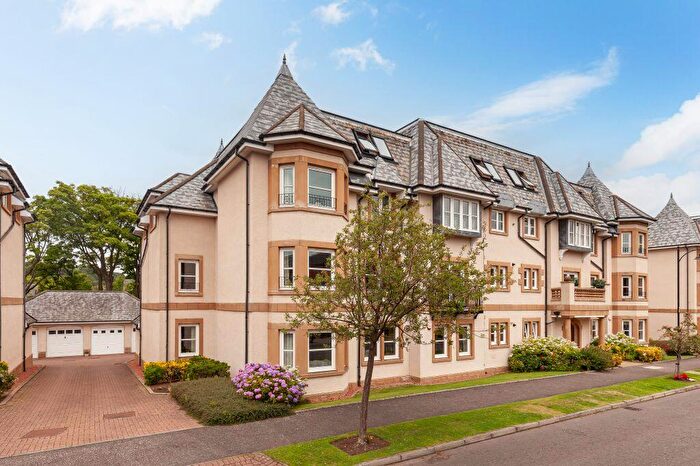
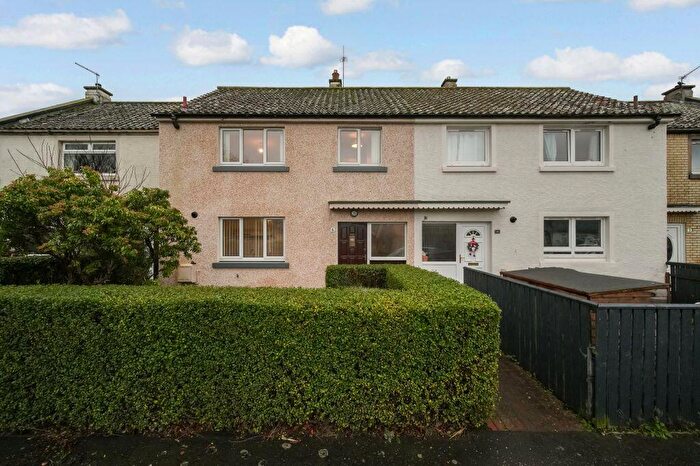
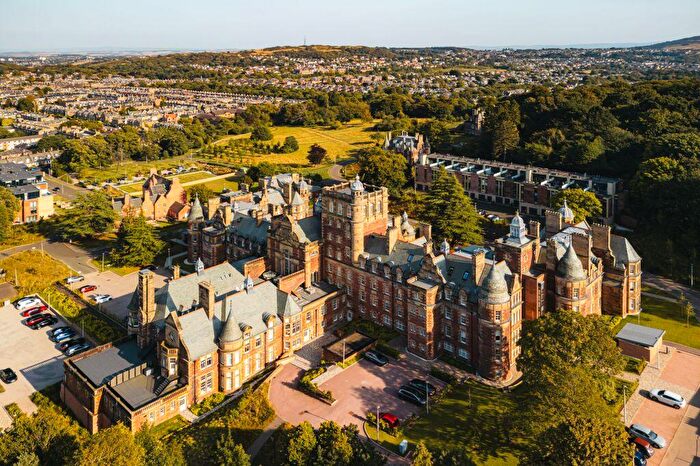
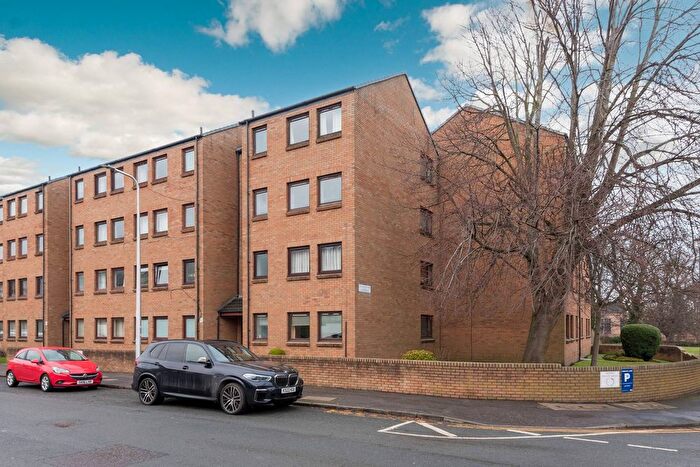
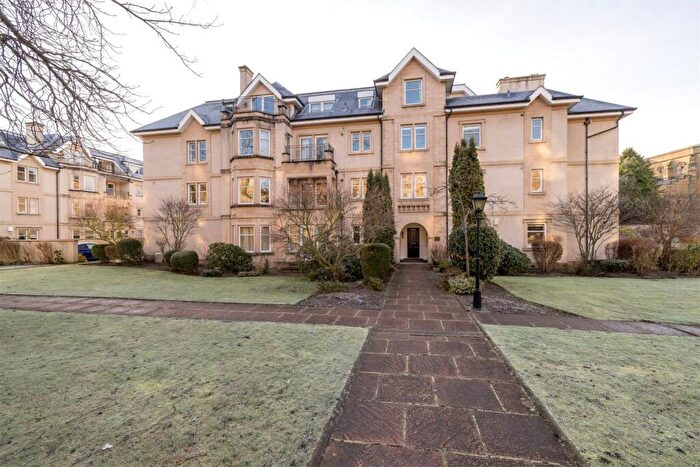
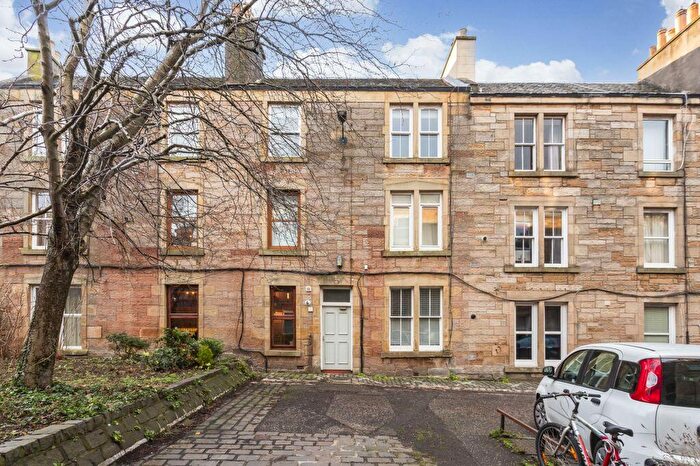
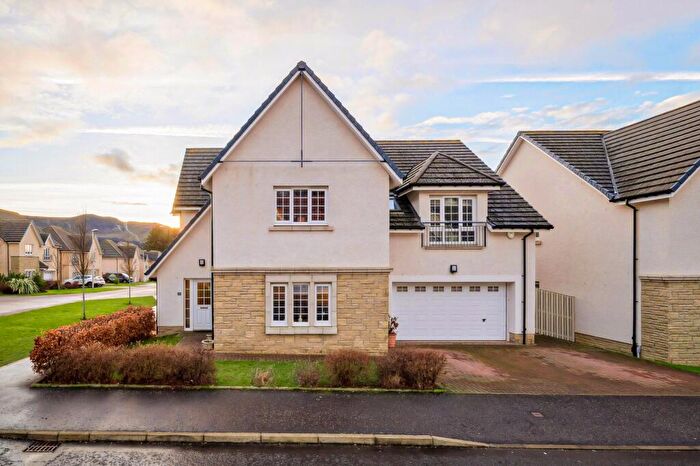
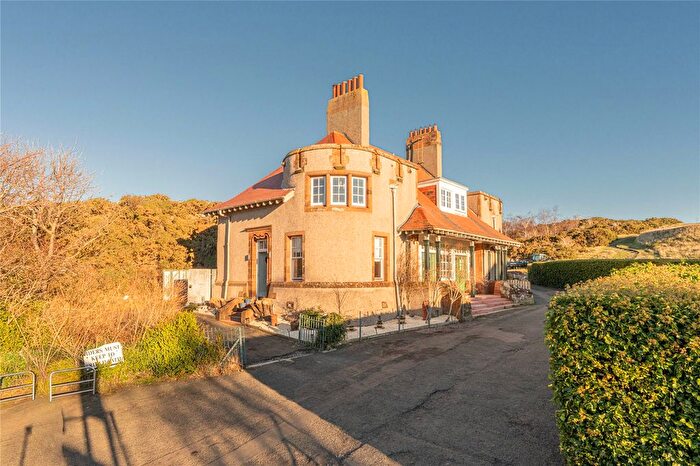
Houses for sale & to rent in Colinton/Fairmilehead, Edinburgh
House Prices in Colinton/Fairmilehead
Properties in Colinton/Fairmilehead have an average house price of £373,270.00 and had 392 Property Transactions within the last 3 years¹.
Colinton/Fairmilehead is an area in Edinburgh, City of Edinburgh with 9,817 households², where the most expensive property was sold for £3,075,000.00.
Properties for sale in Colinton/Fairmilehead
Roads and Postcodes in Colinton/Fairmilehead
Navigate through our locations to find the location of your next house in Colinton/Fairmilehead, Edinburgh for sale or to rent.
Transport near Colinton/Fairmilehead
- FAQ
- Price Paid By Year
Frequently asked questions about Colinton/Fairmilehead
What is the average price for a property for sale in Colinton/Fairmilehead?
The average price for a property for sale in Colinton/Fairmilehead is £373,270. This amount is 12% higher than the average price in Edinburgh. There are 5,054 property listings for sale in Colinton/Fairmilehead.
Which train stations are available in or near Colinton/Fairmilehead?
Some of the train stations available in or near Colinton/Fairmilehead are Slateford, Kingsknowe and Wester Hailes.
Property Price Paid in Colinton/Fairmilehead by Year
The average sold property price by year was:
| Year | Average Sold Price | Price Change |
Sold Properties
|
|---|---|---|---|
| 2023 | £394,887 | 7% |
73 Properties |
| 2022 | £368,324 | -3% |
319 Properties |
| 2021 | £380,426 | 15% |
404 Properties |
| 2020 | £322,394 | -2% |
289 Properties |
| 2019 | £330,385 | 2% |
354 Properties |
| 2018 | £322,141 | 6% |
343 Properties |
| 2017 | £303,031 | -7% |
405 Properties |
| 2016 | £323,128 | 1% |
435 Properties |
| 2015 | £318,748 | 3% |
536 Properties |
| 2014 | £309,788 | 10% |
413 Properties |
| 2013 | £278,409 | 12% |
346 Properties |
| 2012 | £245,553 | -14% |
267 Properties |
| 2011 | £278,948 | -8% |
266 Properties |
| 2010 | £300,420 | 17% |
250 Properties |
| 2009 | £249,930 | -14% |
247 Properties |
| 2008 | £283,896 | 12% |
312 Properties |
| 2007 | £249,605 | 4% |
421 Properties |
| 2006 | £238,551 | 9% |
475 Properties |
| 2005 | £216,265 | 7% |
431 Properties |
| 2004 | £202,167 | 13% |
541 Properties |
| 2003 | £175,520 | 10% |
472 Properties |
| 2002 | £158,079 | 25% |
511 Properties |
| 2001 | £118,862 | -30% |
48 Properties |
| 2000 | £155,062 | - |
30 Properties |

